GrobTea GROBTEA full analysis,charts,indicators,moving averages,SMA,DMA,EMA,ADX,MACD,RSIGrob Tea GROBTEA WideScreen charts, DMA,SMA,EMA technical analysis, forecast prediction, by indicators ADX,MACD,RSI,CCI NSE stock exchange
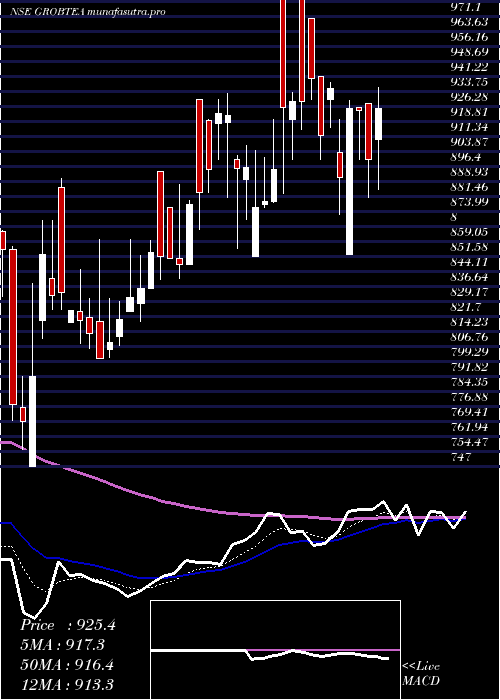
Daily price and charts and targets GrobTea Strong Daily Stock price targets for GrobTea GROBTEA are 998.15 and 1026.95 | Daily Target 1 | 976.23 | | Daily Target 2 | 991.27 | | Daily Target 3 | 1005.0333333333 | | Daily Target 4 | 1020.07 | | Daily Target 5 | 1033.83 |
Daily price and volume Grob Tea
| Date |
Closing |
Open |
Range |
Volume |
Wed 29 October 2025 |
1006.30 (0.04%) |
1000.40 |
990.00 - 1018.80 |
0.532 times |
Tue 28 October 2025 |
1005.90 (-1.14%) |
1013.00 |
977.00 - 1028.70 |
0.9946 times |
Mon 27 October 2025 |
1017.50 (-0.36%) |
1014.70 |
1013.00 - 1028.80 |
1.303 times |
Fri 24 October 2025 |
1021.20 (0.79%) |
1024.00 |
1021.20 - 1030.00 |
1.0332 times |
Thu 23 October 2025 |
1013.20 (0.32%) |
1025.00 |
1013.10 - 1042.00 |
0.9715 times |
Mon 20 October 2025 |
1010.00 (-0.63%) |
1017.40 |
1002.00 - 1017.40 |
0.7864 times |
Fri 17 October 2025 |
1016.40 (-1.03%) |
1020.00 |
1015.00 - 1039.40 |
1.5497 times |
Thu 16 October 2025 |
1027.00 (0.14%) |
1031.10 |
1011.20 - 1044.40 |
1.4495 times |
Wed 15 October 2025 |
1025.60 (-0.89%) |
1034.80 |
1010.00 - 1044.30 |
0.3624 times |
Tue 14 October 2025 |
1034.80 (-2.16%) |
1036.40 |
1025.00 - 1048.30 |
1.0177 times |
Mon 13 October 2025 |
1057.60 (2.08%) |
1064.90 |
1029.00 - 1064.90 |
0.8481 times |
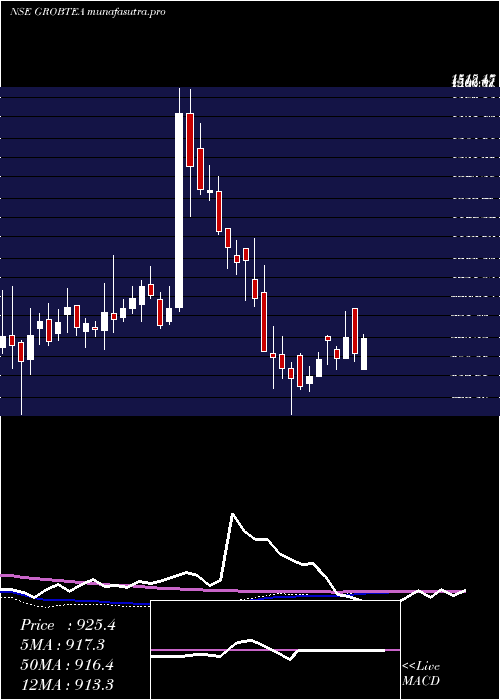
Weekly price and charts GrobTea Strong weekly Stock price targets for GrobTea GROBTEA are 965.75 and 1017.55 | Weekly Target 1 | 952.23 | | Weekly Target 2 | 979.27 | | Weekly Target 3 | 1004.0333333333 | | Weekly Target 4 | 1031.07 | | Weekly Target 5 | 1055.83 |
Weekly price and volumes for Grob Tea
| Date |
Closing |
Open |
Range |
Volume |
Wed 29 October 2025 |
1006.30 (-1.46%) |
1014.70 |
977.00 - 1028.80 |
0.0627 times |
Fri 24 October 2025 |
1021.20 (0.47%) |
1017.40 |
1002.00 - 1042.00 |
0.0618 times |
Fri 17 October 2025 |
1016.40 (-1.9%) |
1064.90 |
1010.00 - 1064.90 |
0.1157 times |
Fri 10 October 2025 |
1036.10 (0.32%) |
1031.40 |
1001.30 - 1149.40 |
0.3856 times |
Fri 03 October 2025 |
1032.80 (-2.64%) |
1074.80 |
1006.10 - 1167.40 |
0.3051 times |
Fri 26 September 2025 |
1060.80 (2.28%) |
1029.30 |
990.00 - 1236.20 |
2.1148 times |
Fri 19 September 2025 |
1037.20 (-12.46%) |
1067.70 |
1000.50 - 1140.00 |
0.5101 times |
Wed 11 June 2025 |
1184.85 (-0.99%) |
1316.75 |
1169.85 - 1359.90 |
4.1634 times |
Fri 06 June 2025 |
1196.75 (20.77%) |
991.10 |
986.05 - 1196.75 |
1.501 times |
Fri 30 May 2025 |
990.95 (-1.47%) |
999.90 |
962.10 - 1074.95 |
0.7798 times |
Fri 23 May 2025 |
1005.75 (12.33%) |
928.00 |
902.40 - 1259.90 |
6.3275 times |
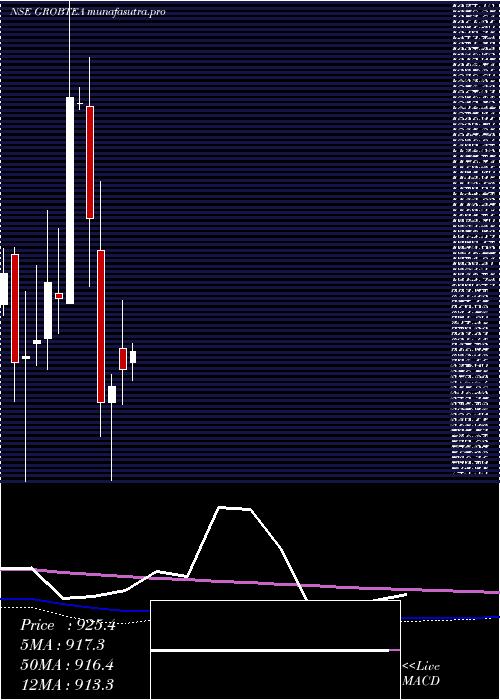
Monthly price and charts GrobTea Strong monthly Stock price targets for GrobTea GROBTEA are 905.45 and 1077.85 | Monthly Target 1 | 871.83 | | Monthly Target 2 | 939.07 | | Monthly Target 3 | 1044.2333333333 | | Monthly Target 4 | 1111.47 | | Monthly Target 5 | 1216.63 |
Monthly price and volumes Grob Tea
| Date |
Closing |
Open |
Range |
Volume |
Wed 29 October 2025 |
1006.30 (-5.48%) |
1064.60 |
977.00 - 1149.40 |
0.115 times |
Tue 30 September 2025 |
1064.60 (-10.15%) |
1067.70 |
990.00 - 1236.20 |
0.4561 times |
Wed 11 June 2025 |
1184.85 (19.57%) |
991.10 |
986.05 - 1359.90 |
0.9098 times |
Fri 30 May 2025 |
990.95 (10.09%) |
910.05 |
835.35 - 1259.90 |
1.2221 times |
Wed 30 April 2025 |
900.10 (2.59%) |
930.00 |
851.90 - 996.00 |
0.1214 times |
Fri 28 March 2025 |
877.35 (2.61%) |
855.25 |
747.00 - 894.00 |
0.24 times |
Fri 28 February 2025 |
855.00 (-22.98%) |
1065.05 |
808.05 - 1160.95 |
0.1847 times |
Fri 31 January 2025 |
1110.05 (-12.59%) |
1265.00 |
1015.00 - 1333.05 |
0.2762 times |
Tue 31 December 2024 |
1270.00 (-0.58%) |
1270.00 |
1260.45 - 1291.90 |
0.0057 times |
Wed 16 October 2024 |
1277.45 (27.9%) |
992.70 |
991.80 - 1515.15 |
6.469 times |
Mon 30 September 2024 |
998.80 (-2.18%) |
1006.00 |
949.95 - 1095.90 |
0.4422 times |
DMA SMA EMA moving averages of Grob Tea GROBTEA
DMA (daily moving average) of Grob Tea GROBTEA
| DMA period | DMA value | | 5 day DMA | 1012.82 | | 12 day DMA | 1022.63 | | 20 day DMA | 1032.8 | | 35 day DMA | 1060.16 | | 50 day DMA | 1039.25 | | 100 day DMA | 955.64 | | 150 day DMA | 1014.74 | | 200 day DMA | 1009.25 | EMA (exponential moving average) of Grob Tea GROBTEA
| EMA period | EMA current | EMA prev | EMA prev2 | | 5 day EMA | 1011.75 | 1014.48 | 1018.77 | | 12 day EMA | 1020.73 | 1023.35 | 1026.52 | | 20 day EMA | 1027.84 | 1030.11 | 1032.66 | | 35 day EMA | 1024.53 | 1025.6 | 1026.76 | | 50 day EMA | 1023 | 1023.68 | 1024.41 |
SMA (simple moving average) of Grob Tea GROBTEA
| SMA period | SMA current | SMA prev | SMA prev2 | | 5 day SMA | 1012.82 | 1013.56 | 1015.66 | | 12 day SMA | 1022.63 | 1022.7 | 1024.78 | | 20 day SMA | 1032.8 | 1035.52 | 1039.03 | | 35 day SMA | 1060.16 | 1059.95 | 1059.79 | | 50 day SMA | 1039.25 | 1036.79 | 1034.36 | | 100 day SMA | 955.64 | 954.29 | 953.03 | | 150 day SMA | 1014.74 | 1015.11 | 1015.06 | | 200 day SMA | 1009.25 | 1008.83 | 1008.55 |
|
|
