GrmOverseas GRMOVER full analysis,charts,indicators,moving averages,SMA,DMA,EMA,ADX,MACD,RSIGrm Overseas GRMOVER WideScreen charts, DMA,SMA,EMA technical analysis, forecast prediction, by indicators ADX,MACD,RSI,CCI NSE stock exchange
Daily price and charts and targets GrmOverseas Strong Daily Stock price targets for GrmOverseas GRMOVER are 411.9 and 426.65 | Daily Target 1 | 400.85 | | Daily Target 2 | 408.2 | | Daily Target 3 | 415.6 | | Daily Target 4 | 422.95 | | Daily Target 5 | 430.35 |
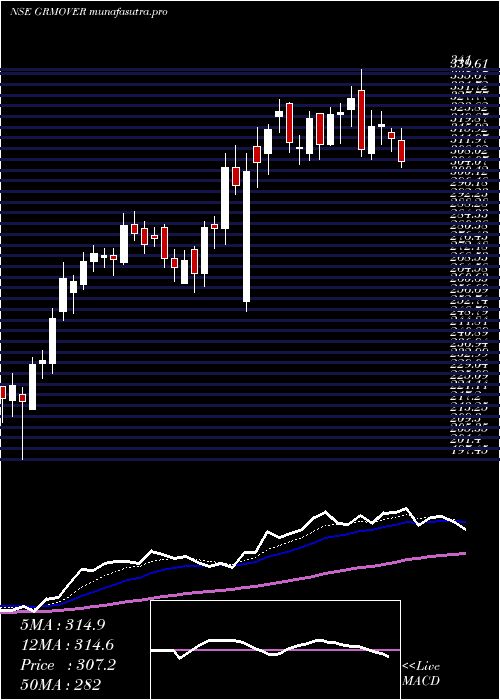
Daily price and volume Grm Overseas
| Date |
Closing |
Open |
Range |
Volume |
Tue 28 October 2025 |
415.55 (1.13%) |
408.25 |
408.25 - 423.00 |
0.5276 times |
Mon 27 October 2025 |
410.90 (-0.6%) |
414.00 |
408.90 - 415.40 |
0.3963 times |
Fri 24 October 2025 |
413.40 (0.63%) |
411.00 |
405.00 - 419.00 |
1.2874 times |
Thu 23 October 2025 |
410.80 (-1.27%) |
414.00 |
406.00 - 425.80 |
1.0259 times |
Tue 21 October 2025 |
416.10 (0.64%) |
413.80 |
412.50 - 420.55 |
0.4368 times |
Mon 20 October 2025 |
413.45 (3.73%) |
405.00 |
399.50 - 414.80 |
1.0114 times |
Fri 17 October 2025 |
398.60 (1.97%) |
389.00 |
388.70 - 401.00 |
1.3809 times |
Thu 16 October 2025 |
390.90 (-2.08%) |
400.00 |
378.10 - 407.00 |
1.9085 times |
Wed 15 October 2025 |
399.20 (0.28%) |
398.95 |
391.75 - 402.40 |
0.9583 times |
Tue 14 October 2025 |
398.10 (0.68%) |
395.40 |
393.35 - 403.60 |
1.0669 times |
Mon 13 October 2025 |
395.40 (0.67%) |
392.00 |
390.40 - 400.80 |
0.7168 times |
Weekly price and charts GrmOverseas Strong weekly Stock price targets for GrmOverseas GRMOVER are 411.9 and 426.65 | Weekly Target 1 | 400.85 | | Weekly Target 2 | 408.2 | | Weekly Target 3 | 415.6 | | Weekly Target 4 | 422.95 | | Weekly Target 5 | 430.35 |
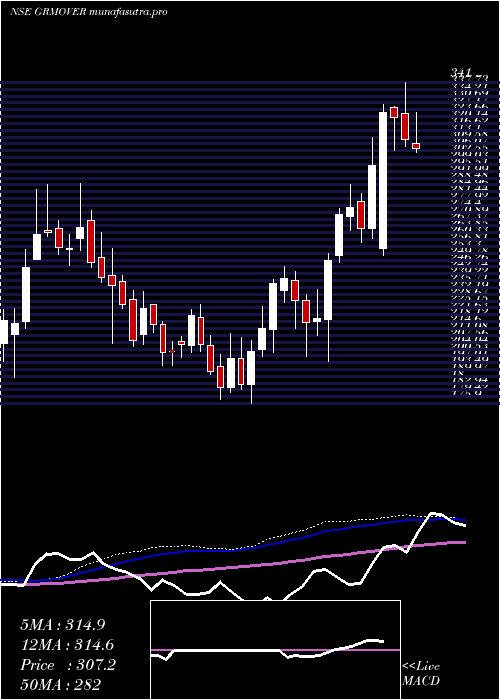
Weekly price and volumes for Grm Overseas
| Date |
Closing |
Open |
Range |
Volume |
Tue 28 October 2025 |
415.55 (0.52%) |
414.00 |
408.25 - 423.00 |
0.2515 times |
Fri 24 October 2025 |
413.40 (3.71%) |
405.00 |
399.50 - 425.80 |
1.0239 times |
Fri 17 October 2025 |
398.60 (1.49%) |
392.00 |
378.10 - 407.00 |
1.6418 times |
Fri 10 October 2025 |
392.75 (6.03%) |
371.95 |
370.05 - 407.25 |
1.8897 times |
Fri 03 October 2025 |
370.40 (2.58%) |
365.80 |
353.50 - 371.20 |
0.7357 times |
Fri 26 September 2025 |
361.10 (2.08%) |
357.95 |
351.50 - 378.00 |
1.3043 times |
Fri 19 September 2025 |
353.75 (-1.78%) |
359.95 |
338.15 - 361.15 |
0.5323 times |
Fri 12 September 2025 |
360.15 (-0.35%) |
362.00 |
357.00 - 369.30 |
0.6756 times |
Fri 05 September 2025 |
361.40 (-1.3%) |
366.00 |
354.05 - 378.45 |
0.7401 times |
Fri 29 August 2025 |
366.15 (-2.29%) |
378.80 |
361.85 - 386.50 |
1.2052 times |
Fri 22 August 2025 |
374.75 (1.43%) |
370.00 |
355.65 - 379.50 |
2.2739 times |
Monthly price and charts GrmOverseas Strong monthly Stock price targets for GrmOverseas GRMOVER are 386.5 and 454.85 | Monthly Target 1 | 331.25 | | Monthly Target 2 | 373.4 | | Monthly Target 3 | 399.6 | | Monthly Target 4 | 441.75 | | Monthly Target 5 | 467.95 |
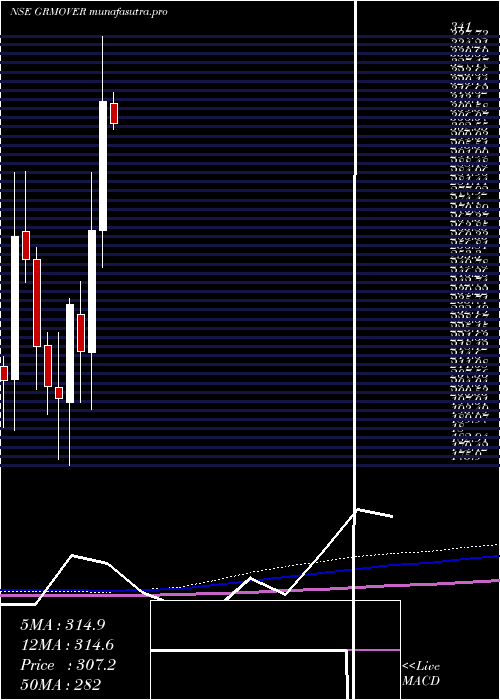
Monthly price and volumes Grm Overseas
| Date |
Closing |
Open |
Range |
Volume |
Tue 28 October 2025 |
415.55 (15.8%) |
358.80 |
357.45 - 425.80 |
1.1635 times |
Tue 30 September 2025 |
358.85 (-1.99%) |
366.00 |
338.15 - 378.45 |
0.8314 times |
Fri 29 August 2025 |
366.15 (-1.41%) |
374.65 |
343.00 - 386.50 |
1.6353 times |
Thu 31 July 2025 |
371.40 (2.43%) |
363.25 |
355.40 - 397.65 |
1.3852 times |
Mon 30 June 2025 |
362.60 (20.45%) |
297.00 |
279.10 - 376.35 |
1.3264 times |
Fri 30 May 2025 |
301.05 (-4.64%) |
315.00 |
270.00 - 319.20 |
0.6539 times |
Wed 30 April 2025 |
315.70 (18.65%) |
266.05 |
252.00 - 341.00 |
0.9659 times |
Fri 28 March 2025 |
266.07 (21.13%) |
219.20 |
197.45 - 288.67 |
0.7681 times |
Fri 28 February 2025 |
219.66 (-7.62%) |
234.00 |
200.25 - 246.70 |
0.717 times |
Fri 31 January 2025 |
237.79 (17.86%) |
200.00 |
175.90 - 240.00 |
0.5533 times |
Tue 31 December 2024 |
201.76 (-2.1%) |
206.00 |
178.00 - 227.00 |
0.2011 times |
DMA SMA EMA moving averages of Grm Overseas GRMOVER
DMA (daily moving average) of Grm Overseas GRMOVER
| DMA period | DMA value | | 5 day DMA | 413.35 | | 12 day DMA | 404.6 | | 20 day DMA | 394.22 | | 35 day DMA | 378.62 | | 50 day DMA | 375.49 | | 100 day DMA | 369.6 | | 150 day DMA | 346.85 | | 200 day DMA | 316.81 | EMA (exponential moving average) of Grm Overseas GRMOVER
| EMA period | EMA current | EMA prev | EMA prev2 | | 5 day EMA | 411.94 | 410.13 | 409.75 | | 12 day EMA | 404.62 | 402.63 | 401.13 | | 20 day EMA | 396.75 | 394.77 | 393.07 | | 35 day EMA | 387.66 | 386.02 | 384.56 | | 50 day EMA | 378.16 | 376.63 | 375.23 |
SMA (simple moving average) of Grm Overseas GRMOVER
| SMA period | SMA current | SMA prev | SMA prev2 | | 5 day SMA | 413.35 | 412.93 | 410.47 | | 12 day SMA | 404.6 | 403.43 | 402.85 | | 20 day SMA | 394.22 | 391.5 | 389.52 | | 35 day SMA | 378.62 | 377.07 | 375.61 | | 50 day SMA | 375.49 | 374.59 | 373.71 | | 100 day SMA | 369.6 | 368.31 | 367.18 | | 150 day SMA | 346.85 | 345.97 | 345.04 | | 200 day SMA | 316.81 | 315.7 | 314.65 |
|
|
