OrientGreen GREENPOWER full analysis,charts,indicators,moving averages,SMA,DMA,EMA,ADX,MACD,RSIOrient Green GREENPOWER WideScreen charts, DMA,SMA,EMA technical analysis, forecast prediction, by indicators ADX,MACD,RSI,CCI NSE stock exchange
operates under Electric Utilities sector
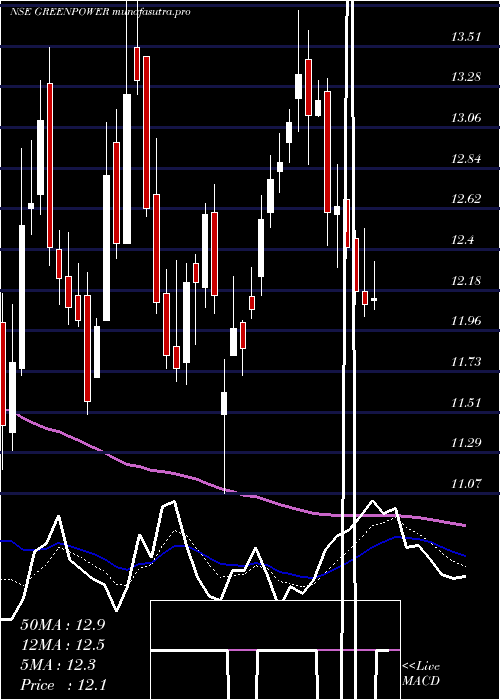
Daily price and charts and targets OrientGreen Strong Daily Stock price targets for OrientGreen GREENPOWER are 13.28 and 13.57 | Daily Target 1 | 13.22 | | Daily Target 2 | 13.34 | | Daily Target 3 | 13.513333333333 | | Daily Target 4 | 13.63 | | Daily Target 5 | 13.8 |
Daily price and volume Orient Green
| Date |
Closing |
Open |
Range |
Volume |
Tue 28 October 2025 |
13.45 (-0.15%) |
13.50 |
13.40 - 13.69 |
0.8563 times |
Mon 27 October 2025 |
13.47 (-1.54%) |
13.68 |
13.40 - 13.96 |
1.4445 times |
Fri 24 October 2025 |
13.68 (0.07%) |
13.79 |
13.53 - 13.98 |
1.3981 times |
Thu 23 October 2025 |
13.67 (3.88%) |
13.20 |
13.13 - 14.01 |
2.8494 times |
Tue 21 October 2025 |
13.16 (0.69%) |
13.20 |
13.10 - 13.25 |
0.3139 times |
Mon 20 October 2025 |
13.07 (1.71%) |
12.83 |
12.70 - 13.15 |
0.8247 times |
Fri 17 October 2025 |
12.85 (-0.62%) |
12.82 |
12.80 - 13.04 |
0.5472 times |
Thu 16 October 2025 |
12.93 (1.02%) |
12.84 |
12.82 - 13.03 |
0.4571 times |
Wed 15 October 2025 |
12.80 (1.11%) |
12.67 |
12.62 - 12.86 |
0.4997 times |
Tue 14 October 2025 |
12.66 (-1.94%) |
12.85 |
12.60 - 12.95 |
0.8091 times |
Mon 13 October 2025 |
12.91 (-1%) |
13.05 |
12.84 - 13.05 |
0.7166 times |
Weekly price and charts OrientGreen Strong weekly Stock price targets for OrientGreen GREENPOWER are 13.15 and 13.71 | Weekly Target 1 | 13.04 | | Weekly Target 2 | 13.25 | | Weekly Target 3 | 13.603333333333 | | Weekly Target 4 | 13.81 | | Weekly Target 5 | 14.16 |
Weekly price and volumes for Orient Green
| Date |
Closing |
Open |
Range |
Volume |
Tue 28 October 2025 |
13.45 (-1.68%) |
13.68 |
13.40 - 13.96 |
0.594 times |
Fri 24 October 2025 |
13.68 (6.46%) |
12.83 |
12.70 - 14.01 |
1.3906 times |
Fri 17 October 2025 |
12.85 (-1.46%) |
13.05 |
12.60 - 13.05 |
0.7822 times |
Fri 10 October 2025 |
13.04 (-1.95%) |
13.32 |
12.86 - 13.37 |
0.9527 times |
Fri 03 October 2025 |
13.30 (0.38%) |
13.27 |
12.78 - 13.45 |
0.8969 times |
Fri 26 September 2025 |
13.25 (-6.89%) |
14.23 |
13.09 - 14.24 |
1.1789 times |
Fri 19 September 2025 |
14.23 (2.52%) |
13.88 |
13.85 - 14.48 |
1.4256 times |
Fri 12 September 2025 |
13.88 (-0.72%) |
14.07 |
13.72 - 14.22 |
0.8136 times |
Fri 05 September 2025 |
13.98 (2.64%) |
13.67 |
13.44 - 14.30 |
1.0273 times |
Fri 29 August 2025 |
13.62 (-4.49%) |
14.55 |
13.50 - 14.68 |
0.938 times |
Fri 22 August 2025 |
14.26 (8.28%) |
15.04 |
14.11 - 15.04 |
4.3603 times |
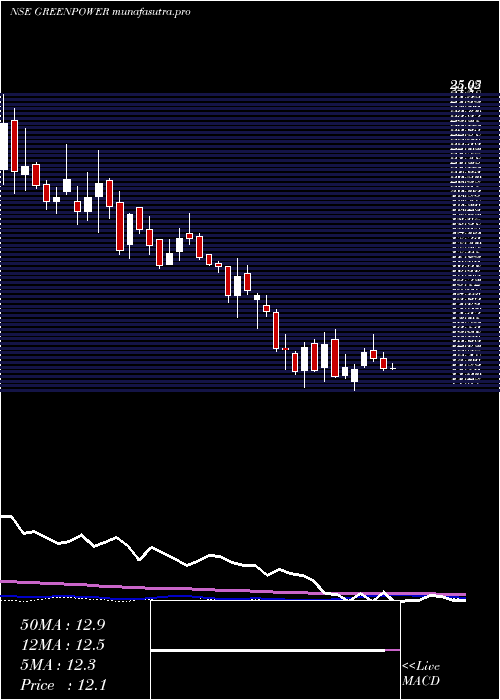
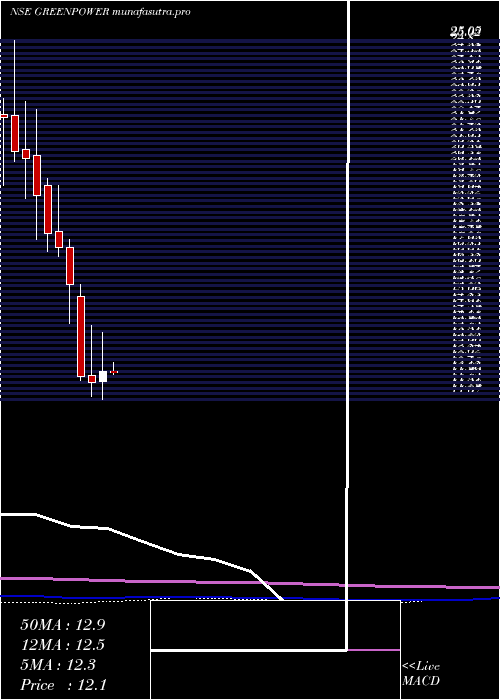
Monthly price and charts OrientGreen Strong monthly Stock price targets for OrientGreen GREENPOWER are 13.03 and 14.44 | Monthly Target 1 | 11.94 | | Monthly Target 2 | 12.7 | | Monthly Target 3 | 13.353333333333 | | Monthly Target 4 | 14.11 | | Monthly Target 5 | 14.76 |
Monthly price and volumes Orient Green
| Date |
Closing |
Open |
Range |
Volume |
Tue 28 October 2025 |
13.45 (4.83%) |
12.82 |
12.60 - 14.01 |
0.4792 times |
Tue 30 September 2025 |
12.83 (-5.8%) |
13.67 |
12.78 - 14.48 |
0.579 times |
Fri 29 August 2025 |
13.62 (-2.99%) |
14.03 |
13.00 - 15.04 |
0.8325 times |
Thu 31 July 2025 |
14.04 (-3.31%) |
14.75 |
13.52 - 15.69 |
1.5365 times |
Mon 30 June 2025 |
14.52 (11.26%) |
13.05 |
12.94 - 15.81 |
2.01 times |
Fri 30 May 2025 |
13.05 (7.23%) |
12.17 |
10.96 - 13.90 |
0.9115 times |
Wed 30 April 2025 |
12.17 (3.57%) |
11.78 |
11.07 - 13.70 |
0.7869 times |
Fri 28 March 2025 |
11.75 (-1.92%) |
12.00 |
11.20 - 13.95 |
1.3556 times |
Fri 28 February 2025 |
11.98 (-23.01%) |
15.10 |
11.81 - 15.56 |
0.5804 times |
Fri 31 January 2025 |
15.56 (-8.36%) |
16.98 |
14.02 - 17.30 |
0.9284 times |
Tue 31 December 2024 |
16.98 (-3.19%) |
17.63 |
16.66 - 19.40 |
1.0737 times |
DMA SMA EMA moving averages of Orient Green GREENPOWER
DMA (daily moving average) of Orient Green GREENPOWER
| DMA period | DMA value | | 5 day DMA | 13.49 | | 12 day DMA | 13.14 | | 20 day DMA | 13.11 | | 35 day DMA | 13.45 | | 50 day DMA | 13.62 | | 100 day DMA | 13.91 | | 150 day DMA | 13.46 | | 200 day DMA | 13.61 | EMA (exponential moving average) of Orient Green GREENPOWER
| EMA period | EMA current | EMA prev | EMA prev2 | | 5 day EMA | 13.42 | 13.41 | 13.38 | | 12 day EMA | 13.28 | 13.25 | 13.21 | | 20 day EMA | 13.29 | 13.27 | 13.25 | | 35 day EMA | 13.37 | 13.36 | 13.35 | | 50 day EMA | 13.57 | 13.58 | 13.58 |
SMA (simple moving average) of Orient Green GREENPOWER
| SMA period | SMA current | SMA prev | SMA prev2 | | 5 day SMA | 13.49 | 13.41 | 13.29 | | 12 day SMA | 13.14 | 13.1 | 13.06 | | 20 day SMA | 13.11 | 13.1 | 13.1 | | 35 day SMA | 13.45 | 13.47 | 13.48 | | 50 day SMA | 13.62 | 13.61 | 13.61 | | 100 day SMA | 13.91 | 13.9 | 13.9 | | 150 day SMA | 13.46 | 13.46 | 13.45 | | 200 day SMA | 13.61 | 13.62 | 13.64 |
|
|
