GreenplyIndustries GREENPLY full analysis,charts,indicators,moving averages,SMA,DMA,EMA,ADX,MACD,RSIGreenply Industries GREENPLY WideScreen charts, DMA,SMA,EMA technical analysis, forecast prediction, by indicators ADX,MACD,RSI,CCI NSE stock exchange
operates under Forest Products sector
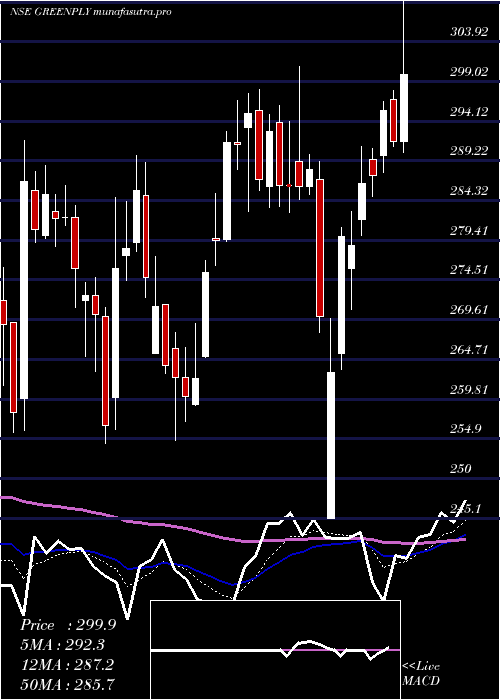
Daily price and charts and targets GreenplyIndustries Strong Daily Stock price targets for GreenplyIndustries GREENPLY are 294.95 and 303.75 | Daily Target 1 | 293.05 | | Daily Target 2 | 296.85 | | Daily Target 3 | 301.85 | | Daily Target 4 | 305.65 | | Daily Target 5 | 310.65 |
Daily price and volume Greenply Industries
| Date |
Closing |
Open |
Range |
Volume |
Tue 28 October 2025 |
300.65 (0.35%) |
300.90 |
298.05 - 306.85 |
0.7165 times |
Mon 27 October 2025 |
299.60 (-1.35%) |
300.05 |
298.10 - 303.70 |
0.4198 times |
Fri 24 October 2025 |
303.70 (-0.1%) |
304.35 |
300.90 - 309.00 |
0.5576 times |
Thu 23 October 2025 |
304.00 (-1.06%) |
305.65 |
303.10 - 308.00 |
0.6062 times |
Tue 21 October 2025 |
307.25 (0.24%) |
309.80 |
303.00 - 315.00 |
0.7415 times |
Mon 20 October 2025 |
306.50 (0.62%) |
302.20 |
302.20 - 312.70 |
1.0867 times |
Fri 17 October 2025 |
304.60 (-0.21%) |
305.95 |
303.40 - 310.00 |
1.4565 times |
Thu 16 October 2025 |
305.25 (2.23%) |
298.60 |
298.10 - 307.00 |
1.61 times |
Wed 15 October 2025 |
298.60 (1.77%) |
294.05 |
294.00 - 302.00 |
1.1541 times |
Tue 14 October 2025 |
293.40 (-0.73%) |
295.55 |
293.00 - 301.70 |
1.651 times |
Mon 13 October 2025 |
295.55 (1.09%) |
291.00 |
291.00 - 304.80 |
2.011 times |
Weekly price and charts GreenplyIndustries Strong weekly Stock price targets for GreenplyIndustries GREENPLY are 299.35 and 308.15 | Weekly Target 1 | 293.05 | | Weekly Target 2 | 296.85 | | Weekly Target 3 | 301.85 | | Weekly Target 4 | 305.65 | | Weekly Target 5 | 310.65 |
Weekly price and volumes for Greenply Industries
| Date |
Closing |
Open |
Range |
Volume |
Tue 28 October 2025 |
300.65 (-1%) |
300.05 |
298.05 - 306.85 |
0.149 times |
Fri 24 October 2025 |
303.70 (-0.3%) |
302.20 |
300.90 - 315.00 |
0.3923 times |
Fri 17 October 2025 |
304.60 (4.19%) |
291.00 |
291.00 - 310.00 |
1.0336 times |
Fri 10 October 2025 |
292.35 (-2.47%) |
297.30 |
289.20 - 300.00 |
0.5762 times |
Fri 03 October 2025 |
299.75 (-2.03%) |
302.00 |
280.30 - 304.70 |
1.4182 times |
Fri 26 September 2025 |
305.95 (-5.54%) |
325.50 |
297.50 - 326.00 |
0.5461 times |
Fri 19 September 2025 |
323.90 (1.6%) |
318.00 |
313.20 - 329.25 |
1.1351 times |
Fri 12 September 2025 |
318.80 (7.74%) |
295.00 |
285.45 - 330.00 |
3.5025 times |
Fri 05 September 2025 |
295.90 (-4.13%) |
308.95 |
295.50 - 309.60 |
0.687 times |
Fri 29 August 2025 |
308.65 (0.18%) |
312.00 |
300.50 - 320.00 |
0.56 times |
Fri 22 August 2025 |
308.10 (0.34%) |
308.25 |
304.30 - 319.00 |
0.4973 times |

Monthly price and charts GreenplyIndustries Strong monthly Stock price targets for GreenplyIndustries GREENPLY are 282.03 and 307.83 | Monthly Target 1 | 275.82 | | Monthly Target 2 | 288.23 | | Monthly Target 3 | 301.61666666667 | | Monthly Target 4 | 314.03 | | Monthly Target 5 | 327.42 |
Monthly price and volumes Greenply Industries
| Date |
Closing |
Open |
Range |
Volume |
Tue 28 October 2025 |
300.65 (-0.31%) |
303.70 |
289.20 - 315.00 |
0.4388 times |
Tue 30 September 2025 |
301.60 (-2.28%) |
308.95 |
280.30 - 330.00 |
1.2637 times |
Fri 29 August 2025 |
308.65 (-4.26%) |
325.60 |
298.70 - 332.00 |
0.4565 times |
Thu 31 July 2025 |
322.40 (2.79%) |
316.80 |
299.00 - 351.95 |
1.6637 times |
Mon 30 June 2025 |
313.65 (-3.06%) |
326.90 |
305.35 - 338.00 |
1.1058 times |
Fri 30 May 2025 |
323.55 (11.42%) |
289.10 |
257.30 - 325.90 |
1.2753 times |
Wed 30 April 2025 |
290.40 (1.47%) |
286.20 |
245.10 - 310.00 |
1.347 times |
Fri 28 March 2025 |
286.20 (4.99%) |
272.60 |
254.35 - 298.00 |
0.7758 times |
Fri 28 February 2025 |
272.60 (-2.69%) |
281.65 |
255.65 - 307.50 |
0.7927 times |
Fri 31 January 2025 |
280.15 (-8.91%) |
307.60 |
255.80 - 323.90 |
0.8806 times |
Tue 31 December 2024 |
307.55 (-9.2%) |
335.70 |
297.90 - 356.00 |
1.3208 times |

DMA SMA EMA moving averages of Greenply Industries GREENPLY
DMA (daily moving average) of Greenply Industries GREENPLY
| DMA period | DMA value | | 5 day DMA | 303.04 | | 12 day DMA | 300.95 | | 20 day DMA | 299.16 | | 35 day DMA | 305.08 | | 50 day DMA | 305.71 | | 100 day DMA | 311.66 | | 150 day DMA | 305.61 | | 200 day DMA | 299.69 | EMA (exponential moving average) of Greenply Industries GREENPLY
| EMA period | EMA current | EMA prev | EMA prev2 | | 5 day EMA | 301.9 | 302.53 | 303.99 | | 12 day EMA | 301.79 | 302 | 302.44 | | 20 day EMA | 302.3 | 302.47 | 302.77 | | 35 day EMA | 303.23 | 303.38 | 303.6 | | 50 day EMA | 305.78 | 305.99 | 306.25 |
SMA (simple moving average) of Greenply Industries GREENPLY
| SMA period | SMA current | SMA prev | SMA prev2 | | 5 day SMA | 303.04 | 304.21 | 305.21 | | 12 day SMA | 300.95 | 300.25 | 299.73 | | 20 day SMA | 299.16 | 299.42 | 299.93 | | 35 day SMA | 305.08 | 304.94 | 304.99 | | 50 day SMA | 305.71 | 305.84 | 306.06 | | 100 day SMA | 311.66 | 311.86 | 312.05 | | 150 day SMA | 305.61 | 305.44 | 305.19 | | 200 day SMA | 299.69 | 299.68 | 299.75 |
|
|
