GreenpanelIndustries GREENPANEL full analysis,charts,indicators,moving averages,SMA,DMA,EMA,ADX,MACD,RSIGreenpanel Industries GREENPANEL WideScreen charts, DMA,SMA,EMA technical analysis, forecast prediction, by indicators ADX,MACD,RSI,CCI NSE stock exchange
Daily price and charts and targets GreenpanelIndustries Strong Daily Stock price targets for GreenpanelIndustries GREENPANEL are 289.9 and 299.85 | Daily Target 1 | 288.02 | | Daily Target 2 | 291.78 | | Daily Target 3 | 297.96666666667 | | Daily Target 4 | 301.73 | | Daily Target 5 | 307.92 |
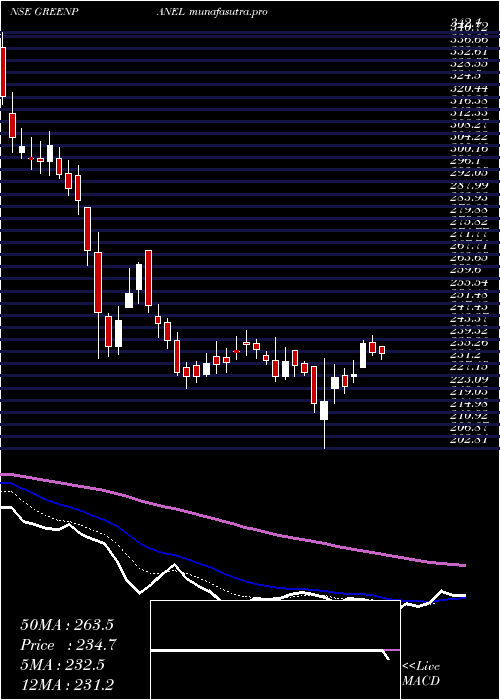
Daily price and volume Greenpanel Industries
| Date |
Closing |
Open |
Range |
Volume |
Wed 29 October 2025 |
295.55 (-0.87%) |
299.70 |
294.20 - 304.15 |
2.5962 times |
Tue 28 October 2025 |
298.15 (-1.11%) |
302.00 |
294.20 - 308.00 |
3.281 times |
Mon 27 October 2025 |
301.50 (1.36%) |
301.80 |
292.80 - 304.00 |
0.3555 times |
Fri 24 October 2025 |
297.45 (-3.3%) |
307.60 |
296.20 - 308.65 |
0.2929 times |
Thu 23 October 2025 |
307.60 (1.17%) |
310.00 |
300.35 - 310.00 |
0.4076 times |
Tue 21 October 2025 |
304.05 (-0.94%) |
302.30 |
300.50 - 310.60 |
0.1503 times |
Mon 20 October 2025 |
306.95 (-1.05%) |
311.95 |
300.55 - 313.05 |
0.7757 times |
Fri 17 October 2025 |
310.20 (4.29%) |
299.00 |
296.35 - 314.00 |
1.2277 times |
Thu 16 October 2025 |
297.45 (1.9%) |
294.50 |
291.25 - 300.05 |
0.2794 times |
Wed 15 October 2025 |
291.90 (2.64%) |
288.65 |
285.60 - 293.55 |
0.6337 times |
Tue 14 October 2025 |
284.40 (-3.66%) |
295.20 |
283.00 - 297.75 |
0.4824 times |
Weekly price and charts GreenpanelIndustries Strong weekly Stock price targets for GreenpanelIndustries GREENPANEL are 286.58 and 301.78 | Weekly Target 1 | 283.58 | | Weekly Target 2 | 289.57 | | Weekly Target 3 | 298.78333333333 | | Weekly Target 4 | 304.77 | | Weekly Target 5 | 313.98 |
Weekly price and volumes for Greenpanel Industries
| Date |
Closing |
Open |
Range |
Volume |
Wed 29 October 2025 |
295.55 (-0.64%) |
301.80 |
292.80 - 308.00 |
0.3824 times |
Fri 24 October 2025 |
297.45 (-4.11%) |
311.95 |
296.20 - 313.05 |
0.0998 times |
Fri 17 October 2025 |
310.20 (0.13%) |
308.00 |
283.00 - 314.00 |
0.1874 times |
Fri 10 October 2025 |
309.80 (3.59%) |
295.05 |
293.25 - 313.00 |
0.3106 times |
Fri 03 October 2025 |
299.05 (8.35%) |
276.00 |
266.25 - 314.40 |
2.7223 times |
Fri 26 September 2025 |
276.00 (-9.69%) |
306.20 |
271.15 - 306.60 |
0.1287 times |
Fri 19 September 2025 |
305.60 (-2.49%) |
312.00 |
298.35 - 316.55 |
0.3209 times |
Fri 12 September 2025 |
313.40 (17.86%) |
267.00 |
265.80 - 333.80 |
5.718 times |
Fri 05 September 2025 |
265.90 (-1.68%) |
270.00 |
263.15 - 287.35 |
0.0826 times |
Fri 29 August 2025 |
270.45 (2.29%) |
264.40 |
262.00 - 273.50 |
0.0475 times |
Fri 22 August 2025 |
264.40 (-3.2%) |
274.90 |
262.55 - 275.75 |
0.0619 times |

Monthly price and charts GreenpanelIndustries Strong monthly Stock price targets for GreenpanelIndustries GREENPANEL are 282.65 and 327.3 | Monthly Target 1 | 248.58 | | Monthly Target 2 | 272.07 | | Monthly Target 3 | 293.23333333333 | | Monthly Target 4 | 316.72 | | Monthly Target 5 | 337.88 |
Monthly price and volumes Greenpanel Industries
| Date |
Closing |
Open |
Range |
Volume |
Wed 29 October 2025 |
295.55 (9.34%) |
270.30 |
269.75 - 314.40 |
2.0495 times |
Tue 30 September 2025 |
270.30 (-0.06%) |
270.00 |
263.15 - 333.80 |
3.5156 times |
Fri 29 August 2025 |
270.45 (-7.96%) |
294.80 |
262.00 - 297.85 |
0.3299 times |
Thu 31 July 2025 |
293.85 (9.32%) |
271.40 |
266.55 - 335.20 |
1.2921 times |
Mon 30 June 2025 |
268.80 (5.35%) |
253.25 |
252.00 - 284.00 |
0.4808 times |
Fri 30 May 2025 |
255.14 (9.8%) |
231.00 |
213.65 - 269.56 |
0.9154 times |
Wed 30 April 2025 |
232.36 (2.41%) |
226.85 |
202.81 - 251.27 |
0.3498 times |
Fri 28 March 2025 |
226.90 (-15.63%) |
268.50 |
222.85 - 275.00 |
0.544 times |
Fri 28 February 2025 |
268.95 (-22.83%) |
359.00 |
264.05 - 395.00 |
0.341 times |
Fri 31 January 2025 |
348.50 (-7.85%) |
372.50 |
312.00 - 380.95 |
0.1819 times |
Tue 31 December 2024 |
378.20 (8.88%) |
347.35 |
341.50 - 418.80 |
0.6493 times |

DMA SMA EMA moving averages of Greenpanel Industries GREENPANEL
DMA (daily moving average) of Greenpanel Industries GREENPANEL
| DMA period | DMA value | | 5 day DMA | 300.05 | | 12 day DMA | 299.2 | | 20 day DMA | 299.37 | | 35 day DMA | 296.98 | | 50 day DMA | 288.6 | | 100 day DMA | 285.26 | | 150 day DMA | 270.38 | | 200 day DMA | 279.98 | EMA (exponential moving average) of Greenpanel Industries GREENPANEL
| EMA period | EMA current | EMA prev | EMA prev2 | | 5 day EMA | 298.98 | 300.7 | 301.97 | | 12 day EMA | 299.59 | 300.32 | 300.71 | | 20 day EMA | 298.15 | 298.42 | 298.45 | | 35 day EMA | 293.61 | 293.5 | 293.23 | | 50 day EMA | 288.37 | 288.08 | 287.67 |
SMA (simple moving average) of Greenpanel Industries GREENPANEL
| SMA period | SMA current | SMA prev | SMA prev2 | | 5 day SMA | 300.05 | 301.75 | 303.51 | | 12 day SMA | 299.2 | 300.39 | 300.96 | | 20 day SMA | 299.37 | 298 | 296.9 | | 35 day SMA | 296.98 | 296.24 | 295.32 | | 50 day SMA | 288.6 | 288.15 | 287.56 | | 100 day SMA | 285.26 | 284.97 | 284.6 | | 150 day SMA | 270.38 | 269.95 | 269.51 | | 200 day SMA | 279.98 | 280.32 | 280.61 |
|
|
