GayatriRubb GRCL_SM full analysis,charts,indicators,moving averages,SMA,DMA,EMA,ADX,MACD,RSIGayatri Rubb GRCL_SM WideScreen charts, DMA,SMA,EMA technical analysis, forecast prediction, by indicators ADX,MACD,RSI,CCI NSE stock exchange
Daily price and charts and targets GayatriRubb Strong Daily Stock price targets for GayatriRubb GRCL_SM are 379 and 379 | Daily Target 1 | 379 | | Daily Target 2 | 379 | | Daily Target 3 | 379 | | Daily Target 4 | 379 | | Daily Target 5 | 379 |
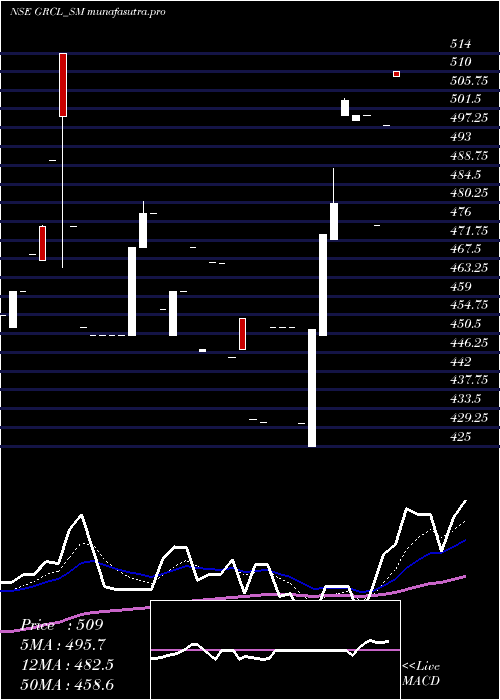
Daily price and volume Gayatri Rubb
| Date |
Closing |
Open |
Range |
Volume |
Tue 09 December 2025 |
379.00 (2.71%) |
379.00 |
379.00 - 379.00 |
0.4 times |
Mon 08 December 2025 |
369.00 (2.5%) |
342.05 |
342.00 - 372.00 |
2 times |
Wed 03 December 2025 |
360.00 (0.56%) |
355.00 |
350.05 - 360.00 |
1.6 times |
Mon 01 December 2025 |
358.00 (-4.28%) |
358.15 |
358.00 - 358.15 |
0.8 times |
Fri 28 November 2025 |
374.00 (0%) |
374.00 |
374.00 - 374.00 |
0.4 times |
Thu 27 November 2025 |
374.00 (-3.83%) |
370.70 |
370.70 - 374.00 |
2.4 times |
Wed 26 November 2025 |
388.90 (4.82%) |
360.05 |
360.05 - 388.95 |
1.2 times |
Tue 25 November 2025 |
371.00 (-4.85%) |
371.00 |
371.00 - 371.00 |
0.4 times |
Mon 24 November 2025 |
389.90 (-0.01%) |
389.90 |
389.90 - 389.90 |
0.4 times |
Wed 19 November 2025 |
389.95 (-0.01%) |
389.95 |
389.95 - 389.95 |
0.4 times |
Tue 18 November 2025 |
390.00 (-2.26%) |
409.50 |
390.00 - 409.50 |
0.8 times |
Weekly price and charts GayatriRubb Strong weekly Stock price targets for GayatriRubb GRCL_SM are 360.5 and 397.5 | Weekly Target 1 | 329.67 | | Weekly Target 2 | 354.33 | | Weekly Target 3 | 366.66666666667 | | Weekly Target 4 | 391.33 | | Weekly Target 5 | 403.67 |
Weekly price and volumes for Gayatri Rubb
| Date |
Closing |
Open |
Range |
Volume |
Tue 09 December 2025 |
379.00 (5.28%) |
342.05 |
342.00 - 379.00 |
0.7692 times |
Wed 03 December 2025 |
360.00 (-3.74%) |
358.15 |
350.05 - 360.00 |
0.7692 times |
Fri 28 November 2025 |
374.00 (-4.09%) |
389.90 |
360.05 - 389.90 |
1.5385 times |
Wed 19 November 2025 |
389.95 (-2.27%) |
409.50 |
389.95 - 409.50 |
0.3846 times |
Fri 14 November 2025 |
399.00 (2.52%) |
369.75 |
369.75 - 407.50 |
0.5128 times |
Fri 07 November 2025 |
389.20 (-2.7%) |
390.00 |
370.70 - 390.00 |
0.641 times |
Thu 30 October 2025 |
400.00 (0.44%) |
404.35 |
387.35 - 410.00 |
1.4103 times |
Thu 23 October 2025 |
398.25 (-2.87%) |
410.00 |
398.25 - 424.00 |
1.0256 times |
Fri 17 October 2025 |
410.00 (2.51%) |
419.00 |
410.00 - 428.30 |
1.4103 times |
Fri 10 October 2025 |
399.95 (7.57%) |
377.70 |
370.00 - 407.90 |
1.5385 times |
Fri 03 October 2025 |
371.80 (5.51%) |
370.00 |
315.60 - 371.80 |
2.9487 times |
Monthly price and charts GayatriRubb Strong monthly Stock price targets for GayatriRubb GRCL_SM are 360.5 and 397.5 | Monthly Target 1 | 329.67 | | Monthly Target 2 | 354.33 | | Monthly Target 3 | 366.66666666667 | | Monthly Target 4 | 391.33 | | Monthly Target 5 | 403.67 |
Monthly price and volumes Gayatri Rubb
| Date |
Closing |
Open |
Range |
Volume |
Tue 09 December 2025 |
379.00 (1.34%) |
358.15 |
342.00 - 379.00 |
0.1786 times |
Fri 28 November 2025 |
374.00 (-6.5%) |
390.00 |
360.05 - 409.50 |
0.3571 times |
Thu 30 October 2025 |
400.00 (8.11%) |
352.00 |
315.60 - 428.30 |
0.9524 times |
Mon 29 September 2025 |
370.00 (-7.24%) |
370.00 |
351.00 - 390.00 |
0.4613 times |
Thu 28 August 2025 |
398.90 (-2.6%) |
391.30 |
350.10 - 415.00 |
0.8631 times |
Thu 31 July 2025 |
409.55 (2.37%) |
385.50 |
370.50 - 433.00 |
2.3363 times |
Mon 30 June 2025 |
400.05 (-23.84%) |
500.55 |
394.25 - 519.00 |
3.2589 times |
Wed 28 May 2025 |
525.25 (16.21%) |
430.00 |
425.00 - 525.25 |
0.8333 times |
Wed 30 April 2025 |
452.00 (-1.74%) |
460.00 |
430.30 - 470.00 |
0.4762 times |
Fri 28 March 2025 |
460.00 (1.77%) |
450.00 |
450.00 - 480.50 |
0.2827 times |
Thu 27 February 2025 |
452.00 (-4.44%) |
451.00 |
435.00 - 514.00 |
0.4018 times |
DMA SMA EMA moving averages of Gayatri Rubb GRCL_SM
DMA (daily moving average) of Gayatri Rubb GRCL_SM
| DMA period | DMA value | | 5 day DMA | 368 | | 12 day DMA | 378.56 | | 20 day DMA | 384.63 | | 35 day DMA | 387.44 | | 50 day DMA | 388.31 | | 100 day DMA | 417.53 | | 150 day DMA | 429.34 | | 200 day DMA | 418.1 | EMA (exponential moving average) of Gayatri Rubb GRCL_SM
| EMA period | EMA current | EMA prev | EMA prev2 | | 5 day EMA | 371.95 | 368.43 | 368.15 | | 12 day EMA | 376.84 | 376.45 | 377.8 | | 20 day EMA | 381.57 | 381.84 | 383.19 | | 35 day EMA | 385.53 | 385.91 | 386.91 | | 50 day EMA | 388.81 | 389.21 | 390.03 |
SMA (simple moving average) of Gayatri Rubb GRCL_SM
| SMA period | SMA current | SMA prev | SMA prev2 | | 5 day SMA | 368 | 367 | 370.98 | | 12 day SMA | 378.56 | 380.3 | 381.99 | | 20 day SMA | 384.63 | 385.59 | 388.1 | | 35 day SMA | 387.44 | 387.27 | 387.59 | | 50 day SMA | 388.31 | 388.92 | 390.16 | | 100 day SMA | 417.53 | 418.26 | 418.88 | | 150 day SMA | 429.34 | 429.66 | 429.92 | | 200 day SMA | 418.1 | 417.82 | 417.59 |
|
|
