GraphiteIndia GRAPHITE full analysis,charts,indicators,moving averages,SMA,DMA,EMA,ADX,MACD,RSIGraphite India GRAPHITE WideScreen charts, DMA,SMA,EMA technical analysis, forecast prediction, by indicators ADX,MACD,RSI,CCI NSE stock exchange
operates under Other Industrial Goods sector
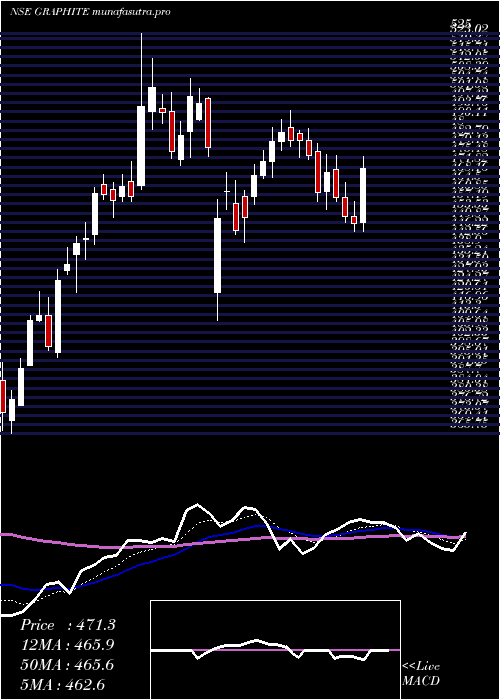
Daily price and charts and targets GraphiteIndia Strong Daily Stock price targets for GraphiteIndia GRAPHITE are 628.45 and 659.4 | Daily Target 1 | 605.28 | | Daily Target 2 | 620.67 | | Daily Target 3 | 636.23333333333 | | Daily Target 4 | 651.62 | | Daily Target 5 | 667.18 |
Daily price and volume Graphite India
| Date |
Closing |
Open |
Range |
Volume |
Thu 30 October 2025 |
636.05 (0.87%) |
625.00 |
620.85 - 651.80 |
1.9598 times |
Wed 29 October 2025 |
630.55 (6.82%) |
592.00 |
588.30 - 638.80 |
5.0986 times |
Tue 28 October 2025 |
590.30 (4.93%) |
567.00 |
564.65 - 593.00 |
1.4199 times |
Mon 27 October 2025 |
562.55 (1.1%) |
559.00 |
556.80 - 567.60 |
0.2275 times |
Fri 24 October 2025 |
556.45 (-0.02%) |
556.30 |
554.85 - 563.90 |
0.1955 times |
Thu 23 October 2025 |
556.55 (0.01%) |
556.50 |
553.80 - 565.60 |
0.2521 times |
Tue 21 October 2025 |
556.50 (1.5%) |
550.00 |
550.00 - 558.05 |
0.1023 times |
Mon 20 October 2025 |
548.30 (-0.55%) |
554.35 |
547.10 - 558.50 |
0.175 times |
Fri 17 October 2025 |
551.35 (-0.87%) |
559.70 |
548.20 - 561.00 |
0.2814 times |
Thu 16 October 2025 |
556.20 (-0.2%) |
557.10 |
554.75 - 564.90 |
0.2879 times |
Wed 15 October 2025 |
557.30 (1.11%) |
550.55 |
550.40 - 559.05 |
0.2677 times |
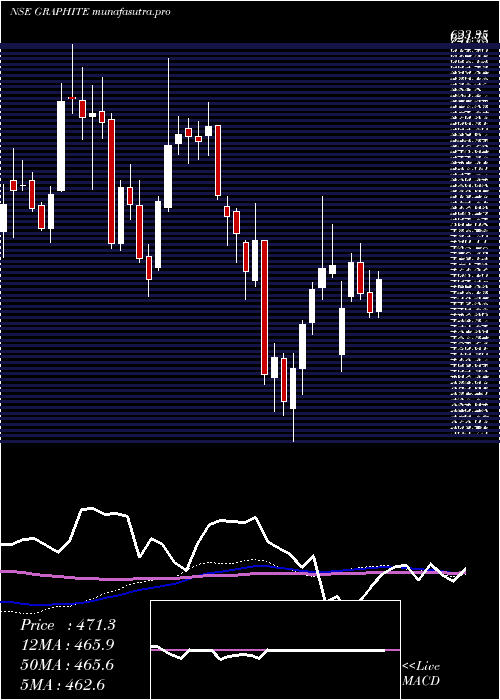
Weekly price and charts GraphiteIndia Strong weekly Stock price targets for GraphiteIndia GRAPHITE are 596.43 and 691.43 | Weekly Target 1 | 519.88 | | Weekly Target 2 | 577.97 | | Weekly Target 3 | 614.88333333333 | | Weekly Target 4 | 672.97 | | Weekly Target 5 | 709.88 |
Weekly price and volumes for Graphite India
| Date |
Closing |
Open |
Range |
Volume |
Thu 30 October 2025 |
636.05 (14.3%) |
559.00 |
556.80 - 651.80 |
2.9113 times |
Fri 24 October 2025 |
556.45 (0.93%) |
554.35 |
547.10 - 565.60 |
0.2424 times |
Fri 17 October 2025 |
551.35 (-2.11%) |
562.45 |
546.10 - 564.90 |
0.5854 times |
Fri 10 October 2025 |
563.25 (1.46%) |
559.00 |
557.95 - 622.00 |
3.5241 times |
Fri 03 October 2025 |
555.15 (0.29%) |
553.35 |
541.20 - 562.85 |
0.2817 times |
Fri 26 September 2025 |
553.55 (-2.87%) |
570.00 |
549.30 - 584.00 |
0.5725 times |
Fri 19 September 2025 |
569.90 (6.84%) |
536.80 |
532.00 - 577.70 |
0.9643 times |
Fri 12 September 2025 |
533.40 (3.28%) |
519.00 |
513.75 - 540.90 |
0.3743 times |
Fri 05 September 2025 |
516.45 (1.11%) |
520.70 |
513.95 - 539.60 |
0.3261 times |
Fri 29 August 2025 |
510.80 (-4.91%) |
539.50 |
505.80 - 541.70 |
0.2179 times |
Fri 22 August 2025 |
537.15 (0.51%) |
538.00 |
534.05 - 558.50 |
0.2941 times |
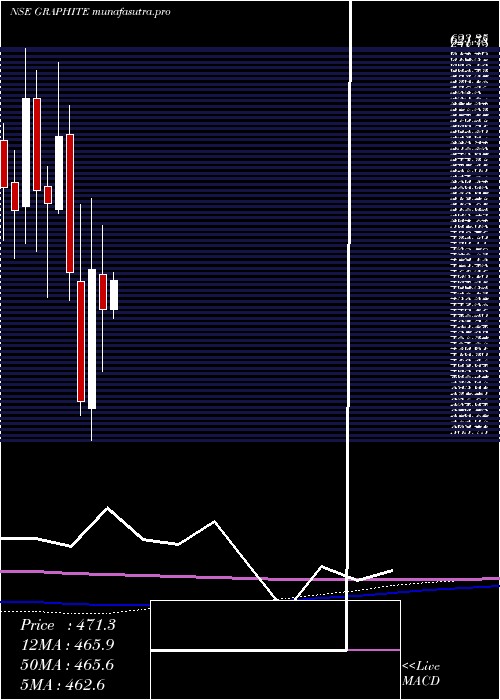
Monthly price and charts GraphiteIndia Strong monthly Stock price targets for GraphiteIndia GRAPHITE are 588.63 and 699.23 | Monthly Target 1 | 499.08 | | Monthly Target 2 | 567.57 | | Monthly Target 3 | 609.68333333333 | | Monthly Target 4 | 678.17 | | Monthly Target 5 | 720.28 |
Monthly price and volumes Graphite India
| Date |
Closing |
Open |
Range |
Volume |
Thu 30 October 2025 |
636.05 (14.51%) |
558.50 |
541.20 - 651.80 |
1.596 times |
Tue 30 September 2025 |
555.45 (8.74%) |
520.70 |
513.75 - 584.00 |
0.5038 times |
Fri 29 August 2025 |
510.80 (-10.82%) |
574.00 |
505.80 - 581.45 |
0.4125 times |
Thu 31 July 2025 |
572.75 (1.16%) |
570.00 |
534.90 - 597.90 |
1.0536 times |
Mon 30 June 2025 |
566.20 (3.67%) |
545.75 |
512.60 - 592.70 |
1.0918 times |
Fri 30 May 2025 |
546.15 (20.78%) |
452.20 |
432.00 - 576.00 |
1.8129 times |
Wed 30 April 2025 |
452.20 (-5.39%) |
475.00 |
411.00 - 506.95 |
0.4115 times |
Fri 28 March 2025 |
477.95 (22.1%) |
387.00 |
365.75 - 525.00 |
2.0435 times |
Fri 28 February 2025 |
391.45 (-17.75%) |
469.95 |
382.50 - 520.60 |
0.5356 times |
Fri 31 January 2025 |
475.90 (-15.81%) |
567.00 |
458.00 - 585.90 |
0.5389 times |
Tue 31 December 2024 |
565.30 (8.4%) |
517.55 |
514.95 - 614.40 |
2.3144 times |
DMA SMA EMA moving averages of Graphite India GRAPHITE
DMA (daily moving average) of Graphite India GRAPHITE
| DMA period | DMA value | | 5 day DMA | 595.18 | | 12 day DMA | 571.11 | | 20 day DMA | 569.83 | | 35 day DMA | 562.54 | | 50 day DMA | 551.47 | | 100 day DMA | 552.44 | | 150 day DMA | 532.94 | | 200 day DMA | 513.38 | EMA (exponential moving average) of Graphite India GRAPHITE
| EMA period | EMA current | EMA prev | EMA prev2 | | 5 day EMA | 604.91 | 589.34 | 568.74 | | 12 day EMA | 583.1 | 573.48 | 563.11 | | 20 day EMA | 573.92 | 567.38 | 560.73 | | 35 day EMA | 562.73 | 558.41 | 554.16 | | 50 day EMA | 554.92 | 551.61 | 548.39 |
SMA (simple moving average) of Graphite India GRAPHITE
| SMA period | SMA current | SMA prev | SMA prev2 | | 5 day SMA | 595.18 | 579.28 | 564.47 | | 12 day SMA | 571.11 | 564.29 | 558.68 | | 20 day SMA | 569.83 | 565.8 | 561.56 | | 35 day SMA | 562.54 | 559.22 | 555.92 | | 50 day SMA | 551.47 | 549.72 | 547.8 | | 100 day SMA | 552.44 | 551.5 | 550.74 | | 150 day SMA | 532.94 | 531.79 | 530.65 | | 200 day SMA | 513.38 | 512.94 | 512.55 |
|
|
