GranulesIndia GRANULES full analysis,charts,indicators,moving averages,SMA,DMA,EMA,ADX,MACD,RSIGranules India GRANULES WideScreen charts, DMA,SMA,EMA technical analysis, forecast prediction, by indicators ADX,MACD,RSI,CCI NSE stock exchange
operates under Pharmaceuticals sector
Daily price and charts and targets GranulesIndia Strong Daily Stock price targets for GranulesIndia GRANULES are 567.48 and 577.18 | Daily Target 1 | 560.18 | | Daily Target 2 | 565.07 | | Daily Target 3 | 569.88333333333 | | Daily Target 4 | 574.77 | | Daily Target 5 | 579.58 |
Daily price and volume Granules India
| Date |
Closing |
Open |
Range |
Volume |
Tue 28 October 2025 |
569.95 (0.77%) |
565.65 |
565.00 - 574.70 |
0.4804 times |
Mon 27 October 2025 |
565.60 (0.19%) |
563.95 |
558.05 - 572.70 |
0.6533 times |
Fri 24 October 2025 |
564.55 (1.33%) |
559.75 |
554.85 - 568.60 |
0.578 times |
Thu 23 October 2025 |
557.15 (-2.26%) |
572.90 |
554.45 - 573.75 |
1.2996 times |
Tue 21 October 2025 |
570.05 (0.75%) |
566.90 |
566.90 - 572.90 |
0.1295 times |
Mon 20 October 2025 |
565.80 (-0.66%) |
570.00 |
562.00 - 571.95 |
0.5893 times |
Fri 17 October 2025 |
569.55 (-0.1%) |
570.50 |
567.05 - 574.70 |
0.7629 times |
Thu 16 October 2025 |
570.10 (0.22%) |
573.00 |
567.30 - 576.10 |
0.5337 times |
Wed 15 October 2025 |
568.85 (-0.2%) |
577.00 |
567.05 - 587.20 |
2.0071 times |
Tue 14 October 2025 |
570.00 (1.06%) |
567.45 |
560.00 - 576.55 |
2.9661 times |
Mon 13 October 2025 |
564.00 (-0.8%) |
570.15 |
559.40 - 571.70 |
0.5689 times |
Weekly price and charts GranulesIndia Strong weekly Stock price targets for GranulesIndia GRANULES are 564 and 580.65 | Weekly Target 1 | 550.92 | | Weekly Target 2 | 560.43 | | Weekly Target 3 | 567.56666666667 | | Weekly Target 4 | 577.08 | | Weekly Target 5 | 584.22 |
Weekly price and volumes for Granules India
| Date |
Closing |
Open |
Range |
Volume |
Tue 28 October 2025 |
569.95 (0.96%) |
563.95 |
558.05 - 574.70 |
0.1331 times |
Fri 24 October 2025 |
564.55 (-0.88%) |
570.00 |
554.45 - 573.75 |
0.3049 times |
Fri 17 October 2025 |
569.55 (0.18%) |
570.15 |
559.40 - 587.20 |
0.8031 times |
Fri 10 October 2025 |
568.55 (2.02%) |
560.45 |
545.05 - 575.35 |
0.7297 times |
Fri 03 October 2025 |
557.30 (8.02%) |
515.95 |
510.90 - 562.70 |
0.8695 times |
Fri 26 September 2025 |
515.90 (-5.06%) |
545.05 |
510.55 - 546.75 |
0.4901 times |
Fri 19 September 2025 |
543.40 (1.69%) |
535.45 |
529.05 - 553.00 |
0.6032 times |
Fri 12 September 2025 |
534.35 (4.49%) |
513.40 |
511.40 - 535.90 |
0.575 times |
Fri 05 September 2025 |
511.40 (3.89%) |
494.00 |
492.45 - 524.80 |
1.5986 times |
Fri 29 August 2025 |
492.25 (7.36%) |
460.95 |
456.30 - 512.90 |
3.8929 times |
Fri 22 August 2025 |
458.50 (-0.2%) |
464.95 |
452.50 - 465.80 |
0.4637 times |
Monthly price and charts GranulesIndia Strong monthly Stock price targets for GranulesIndia GRANULES are 546.33 and 610.83 | Monthly Target 1 | 495.45 | | Monthly Target 2 | 532.7 | | Monthly Target 3 | 559.95 | | Monthly Target 4 | 597.2 | | Monthly Target 5 | 624.45 |
Monthly price and volumes Granules India
| Date |
Closing |
Open |
Range |
Volume |
Tue 28 October 2025 |
569.95 (10.24%) |
522.70 |
522.70 - 587.20 |
0.7928 times |
Tue 30 September 2025 |
517.00 (5.03%) |
494.00 |
492.45 - 553.00 |
1.0517 times |
Fri 29 August 2025 |
492.25 (3.65%) |
475.95 |
432.60 - 512.90 |
1.7844 times |
Thu 31 July 2025 |
474.90 (-4.12%) |
496.80 |
461.45 - 511.75 |
0.6979 times |
Mon 30 June 2025 |
495.30 (-6.64%) |
530.10 |
478.25 - 547.10 |
0.6822 times |
Fri 30 May 2025 |
530.55 (16.4%) |
456.20 |
430.70 - 544.75 |
1.0826 times |
Wed 30 April 2025 |
455.80 (-6.28%) |
488.00 |
422.00 - 502.50 |
0.8673 times |
Fri 28 March 2025 |
486.35 (5.32%) |
460.00 |
453.50 - 517.45 |
0.9127 times |
Fri 28 February 2025 |
461.80 (-16.99%) |
554.90 |
456.25 - 599.20 |
0.8125 times |
Fri 31 January 2025 |
556.35 (-6.07%) |
589.00 |
502.25 - 621.10 |
1.316 times |
Tue 31 December 2024 |
592.30 (1.37%) |
580.10 |
526.95 - 628.00 |
2.7419 times |
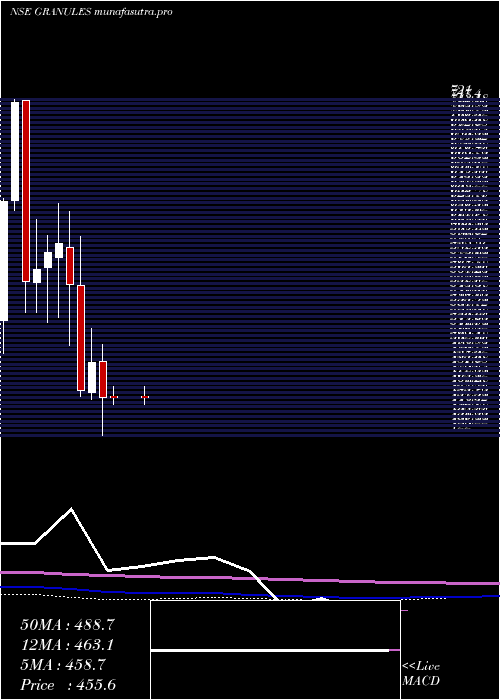
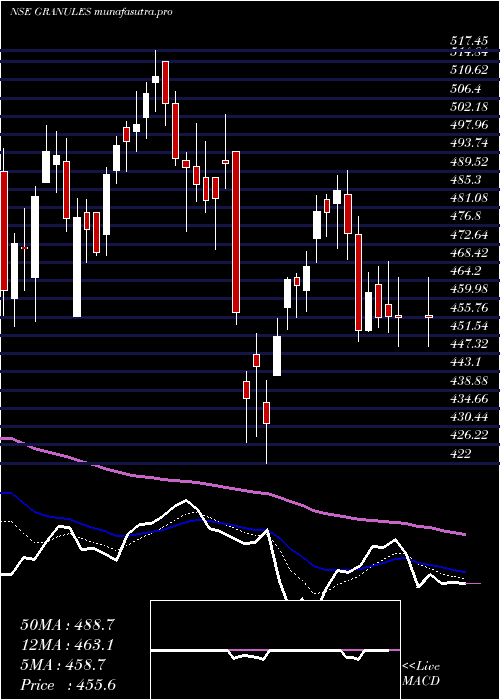
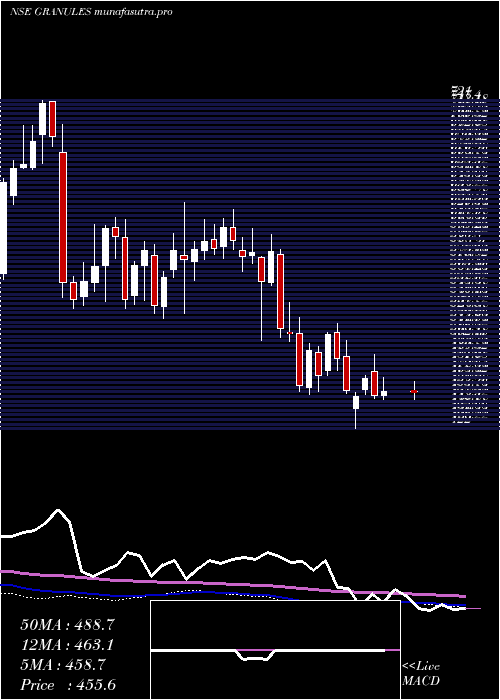
DMA SMA EMA moving averages of Granules India GRANULES
DMA (daily moving average) of Granules India GRANULES
| DMA period | DMA value | | 5 day DMA | 565.46 | | 12 day DMA | 567.01 | | 20 day DMA | 557.96 | | 35 day DMA | 546.32 | | 50 day DMA | 526.76 | | 100 day DMA | 506.85 | | 150 day DMA | 499.51 | | 200 day DMA | 509.52 | EMA (exponential moving average) of Granules India GRANULES
| EMA period | EMA current | EMA prev | EMA prev2 | | 5 day EMA | 566.56 | 564.86 | 564.49 | | 12 day EMA | 563.51 | 562.34 | 561.75 | | 20 day EMA | 556.95 | 555.58 | 554.53 | | 35 day EMA | 541.06 | 539.36 | 537.81 | | 50 day EMA | 524.25 | 522.39 | 520.63 |
SMA (simple moving average) of Granules India GRANULES
| SMA period | SMA current | SMA prev | SMA prev2 | | 5 day SMA | 565.46 | 564.63 | 565.42 | | 12 day SMA | 567.01 | 566.7 | 565.29 | | 20 day SMA | 557.96 | 555.26 | 553.49 | | 35 day SMA | 546.32 | 544.65 | 543.14 | | 50 day SMA | 526.76 | 524.57 | 522.36 | | 100 day SMA | 506.85 | 506.43 | 505.99 | | 150 day SMA | 499.51 | 499.02 | 498.55 | | 200 day SMA | 509.52 | 509.71 | 509.91 |
|
|
