GptInfraproject GPTINFRA full analysis,charts,indicators,moving averages,SMA,DMA,EMA,ADX,MACD,RSIGpt Infraproject GPTINFRA WideScreen charts, DMA,SMA,EMA technical analysis, forecast prediction, by indicators ADX,MACD,RSI,CCI NSE stock exchange
operates under Construction & Engineering sector
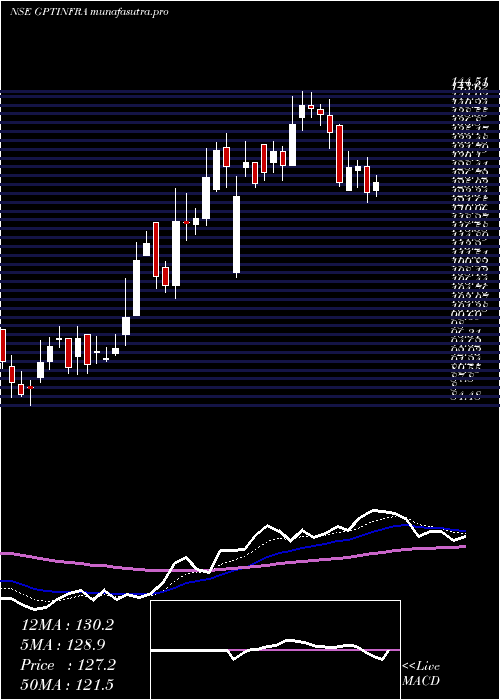
Daily price and charts and targets GptInfraproject Strong Daily Stock price targets for GptInfraproject GPTINFRA are 106.19 and 110.94 | Daily Target 1 | 105.24 | | Daily Target 2 | 107.13 | | Daily Target 3 | 109.99 | | Daily Target 4 | 111.88 | | Daily Target 5 | 114.74 |
Daily price and volume Gpt Infraproject
| Date |
Closing |
Open |
Range |
Volume |
Tue 28 October 2025 |
109.02 (-1.39%) |
110.80 |
108.10 - 112.85 |
0.5509 times |
Mon 27 October 2025 |
110.56 (6.87%) |
106.88 |
106.88 - 117.90 |
8.5309 times |
Fri 24 October 2025 |
103.45 (-1.1%) |
104.60 |
103.10 - 105.02 |
0.0738 times |
Thu 23 October 2025 |
104.60 (-2.12%) |
108.45 |
104.30 - 108.85 |
0.1841 times |
Tue 21 October 2025 |
106.87 (2.12%) |
103.60 |
103.60 - 107.47 |
0.0369 times |
Mon 20 October 2025 |
104.65 (-0.36%) |
105.00 |
103.06 - 105.50 |
0.1379 times |
Fri 17 October 2025 |
105.03 (-0.87%) |
106.01 |
104.48 - 106.89 |
0.1056 times |
Thu 16 October 2025 |
105.95 (-0.94%) |
107.39 |
105.65 - 108.08 |
0.092 times |
Wed 15 October 2025 |
106.96 (0.52%) |
106.41 |
106.41 - 109.88 |
0.1244 times |
Tue 14 October 2025 |
106.41 (-2.9%) |
109.70 |
104.50 - 109.96 |
0.1634 times |
Mon 13 October 2025 |
109.59 (-2.07%) |
111.50 |
108.16 - 111.90 |
0.1171 times |
Weekly price and charts GptInfraproject Strong weekly Stock price targets for GptInfraproject GPTINFRA are 107.95 and 118.97 | Weekly Target 1 | 100.25 | | Weekly Target 2 | 104.63 | | Weekly Target 3 | 111.26666666667 | | Weekly Target 4 | 115.65 | | Weekly Target 5 | 122.29 |
Weekly price and volumes for Gpt Infraproject
| Date |
Closing |
Open |
Range |
Volume |
Tue 28 October 2025 |
109.02 (5.38%) |
106.88 |
106.88 - 117.90 |
5.923 times |
Fri 24 October 2025 |
103.45 (-1.5%) |
105.00 |
103.06 - 108.85 |
0.2822 times |
Fri 17 October 2025 |
105.03 (-6.15%) |
111.50 |
104.48 - 111.90 |
0.393 times |
Fri 10 October 2025 |
111.91 (-2.9%) |
115.60 |
110.24 - 116.50 |
0.3892 times |
Fri 03 October 2025 |
115.25 (-0.47%) |
115.05 |
112.00 - 117.90 |
0.2093 times |
Fri 26 September 2025 |
115.80 (-5.2%) |
122.15 |
113.30 - 124.49 |
0.3582 times |
Fri 19 September 2025 |
122.15 (5.32%) |
115.70 |
115.30 - 124.39 |
0.5354 times |
Fri 12 September 2025 |
115.98 (0.61%) |
115.74 |
111.12 - 125.00 |
1.1377 times |
Fri 05 September 2025 |
115.28 (3.41%) |
112.00 |
108.80 - 119.79 |
0.5243 times |
Fri 29 August 2025 |
111.48 (-4.83%) |
118.30 |
109.98 - 119.50 |
0.2475 times |
Fri 22 August 2025 |
117.14 (1.58%) |
115.89 |
114.40 - 123.01 |
0.3644 times |

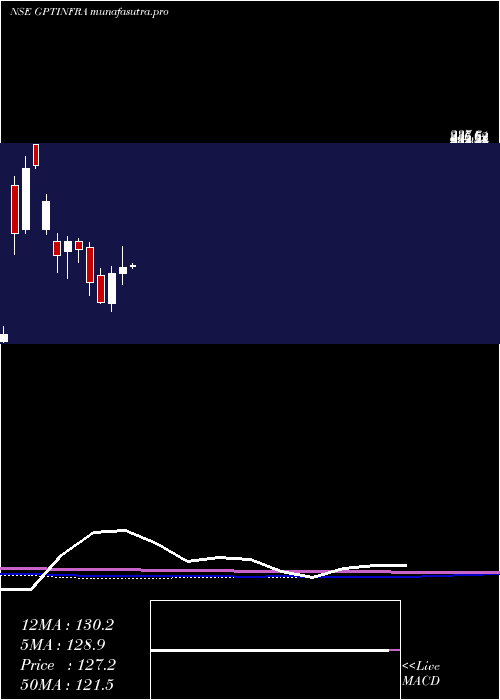
Monthly price and charts GptInfraproject Strong monthly Stock price targets for GptInfraproject GPTINFRA are 98.62 and 113.46 | Monthly Target 1 | 95.15 | | Monthly Target 2 | 102.09 | | Monthly Target 3 | 109.99333333333 | | Monthly Target 4 | 116.93 | | Monthly Target 5 | 124.83 |
Monthly price and volumes Gpt Infraproject
| Date |
Closing |
Open |
Range |
Volume |
Tue 28 October 2025 |
109.02 (-3.18%) |
113.43 |
103.06 - 117.90 |
1.8241 times |
Tue 30 September 2025 |
112.60 (1%) |
112.00 |
108.80 - 125.00 |
0.6825 times |
Fri 29 August 2025 |
111.48 (-13.33%) |
128.62 |
109.98 - 140.90 |
0.7679 times |
Thu 31 July 2025 |
128.62 (0.13%) |
127.30 |
121.60 - 139.50 |
1.2639 times |
Mon 30 June 2025 |
128.45 (-9.15%) |
140.70 |
121.06 - 145.00 |
0.4813 times |
Fri 30 May 2025 |
141.38 (12.96%) |
125.60 |
112.00 - 149.80 |
0.8975 times |
Wed 30 April 2025 |
125.16 (4.77%) |
119.00 |
109.01 - 144.51 |
1.0782 times |
Fri 28 March 2025 |
119.46 (28.67%) |
92.01 |
84.48 - 126.01 |
1.5206 times |
Fri 28 February 2025 |
92.84 (-16.29%) |
118.00 |
91.50 - 124.40 |
0.6192 times |
Fri 31 January 2025 |
110.91 (-21.64%) |
143.00 |
99.20 - 147.50 |
0.8646 times |
Tue 31 December 2024 |
141.54 (-4.82%) |
148.71 |
130.00 - 152.01 |
0.7226 times |
DMA SMA EMA moving averages of Gpt Infraproject GPTINFRA
DMA (daily moving average) of Gpt Infraproject GPTINFRA
| DMA period | DMA value | | 5 day DMA | 106.9 | | 12 day DMA | 107.08 | | 20 day DMA | 109.59 | | 35 day DMA | 113.45 | | 50 day DMA | 114.46 | | 100 day DMA | 121.55 | | 150 day DMA | 124.61 | | 200 day DMA | 121.11 | EMA (exponential moving average) of Gpt Infraproject GPTINFRA
| EMA period | EMA current | EMA prev | EMA prev2 | | 5 day EMA | 107.59 | 106.87 | 105.02 | | 12 day EMA | 108.02 | 107.84 | 107.34 | | 20 day EMA | 109.57 | 109.63 | 109.53 | | 35 day EMA | 111.71 | 111.87 | 111.95 | | 50 day EMA | 114.28 | 114.49 | 114.65 |
SMA (simple moving average) of Gpt Infraproject GPTINFRA
| SMA period | SMA current | SMA prev | SMA prev2 | | 5 day SMA | 106.9 | 106.03 | 104.92 | | 12 day SMA | 107.08 | 107.32 | 107.51 | | 20 day SMA | 109.59 | 109.93 | 110.21 | | 35 day SMA | 113.45 | 113.63 | 113.8 | | 50 day SMA | 114.46 | 114.62 | 114.78 | | 100 day SMA | 121.55 | 121.87 | 122.16 | | 150 day SMA | 124.61 | 124.52 | 124.41 | | 200 day SMA | 121.11 | 121.24 | 121.41 |
|
|
