GodawariPower GPIL full analysis,charts,indicators,moving averages,SMA,DMA,EMA,ADX,MACD,RSIGodawari Power GPIL WideScreen charts, DMA,SMA,EMA technical analysis, forecast prediction, by indicators ADX,MACD,RSI,CCI NSE stock exchange
operates under Iron & Steel sector
Daily price and charts and targets GodawariPower Strong Daily Stock price targets for GodawariPower GPIL are 250 and 257.14 | Daily Target 1 | 244.46 | | Daily Target 2 | 248.4 | | Daily Target 3 | 251.6 | | Daily Target 4 | 255.54 | | Daily Target 5 | 258.74 |
Daily price and volume Godawari Power
| Date |
Closing |
Open |
Range |
Volume |
Mon 20 October 2025 |
252.34 (1.1%) |
249.60 |
247.66 - 254.80 |
0.7844 times |
Fri 17 October 2025 |
249.60 (2.78%) |
242.07 |
241.25 - 258.56 |
3.8915 times |
Thu 16 October 2025 |
242.85 (-2.26%) |
250.00 |
242.00 - 251.00 |
0.6559 times |
Wed 15 October 2025 |
248.47 (1.7%) |
245.00 |
242.20 - 251.00 |
1.5499 times |
Tue 14 October 2025 |
244.31 (1.39%) |
240.00 |
236.02 - 245.00 |
0.9571 times |
Mon 13 October 2025 |
240.96 (-1.06%) |
243.00 |
239.50 - 244.53 |
0.3654 times |
Fri 10 October 2025 |
243.54 (0.12%) |
243.01 |
240.47 - 245.00 |
0.419 times |
Thu 09 October 2025 |
243.25 (0.79%) |
240.30 |
239.00 - 246.30 |
0.5602 times |
Wed 08 October 2025 |
241.34 (-0.8%) |
243.00 |
240.48 - 243.36 |
0.3566 times |
Tue 07 October 2025 |
243.28 (-1.03%) |
246.49 |
240.50 - 247.20 |
0.4599 times |
Mon 06 October 2025 |
245.82 (-0.63%) |
247.10 |
244.01 - 249.00 |
0.7536 times |
Weekly price and charts GodawariPower Strong weekly Stock price targets for GodawariPower GPIL are 250 and 257.14 | Weekly Target 1 | 244.46 | | Weekly Target 2 | 248.4 | | Weekly Target 3 | 251.6 | | Weekly Target 4 | 255.54 | | Weekly Target 5 | 258.74 |
Weekly price and volumes for Godawari Power
| Date |
Closing |
Open |
Range |
Volume |
Mon 20 October 2025 |
252.34 (1.1%) |
249.60 |
247.66 - 254.80 |
0.0752 times |
Fri 17 October 2025 |
249.60 (2.49%) |
243.00 |
236.02 - 258.56 |
0.7113 times |
Fri 10 October 2025 |
243.54 (-1.56%) |
247.10 |
239.00 - 249.00 |
0.2444 times |
Fri 03 October 2025 |
247.39 (-3.56%) |
249.00 |
241.01 - 258.54 |
0.4227 times |
Fri 26 September 2025 |
256.51 (-1.99%) |
265.00 |
252.50 - 278.00 |
1.4967 times |
Fri 19 September 2025 |
261.71 (7.23%) |
245.20 |
245.20 - 275.50 |
2.9683 times |
Fri 12 September 2025 |
244.07 (0.7%) |
243.98 |
235.30 - 248.65 |
0.4388 times |
Fri 05 September 2025 |
242.37 (4.3%) |
240.00 |
237.67 - 253.88 |
1.1823 times |
Fri 29 August 2025 |
232.38 (-2.61%) |
239.00 |
231.13 - 249.50 |
0.682 times |
Fri 22 August 2025 |
238.61 (17.68%) |
203.59 |
197.10 - 241.80 |
1.7783 times |
Thu 14 August 2025 |
202.76 (7.92%) |
187.88 |
186.00 - 206.18 |
0.395 times |
Monthly price and charts GodawariPower Strong monthly Stock price targets for GodawariPower GPIL are 244.18 and 266.72 | Monthly Target 1 | 226.43 | | Monthly Target 2 | 239.39 | | Monthly Target 3 | 248.97333333333 | | Monthly Target 4 | 261.93 | | Monthly Target 5 | 271.51 |
Monthly price and volumes Godawari Power
| Date |
Closing |
Open |
Range |
Volume |
Mon 20 October 2025 |
252.34 (3.08%) |
244.80 |
236.02 - 258.56 |
0.5495 times |
Tue 30 September 2025 |
244.80 (5.34%) |
240.00 |
235.30 - 278.00 |
2.9469 times |
Fri 29 August 2025 |
232.38 (19.67%) |
194.00 |
185.32 - 249.50 |
1.5528 times |
Thu 31 July 2025 |
194.19 (2.53%) |
189.02 |
179.25 - 198.20 |
0.6258 times |
Mon 30 June 2025 |
189.39 (-0.57%) |
192.23 |
175.37 - 198.00 |
0.5765 times |
Fri 30 May 2025 |
190.48 (4.46%) |
182.35 |
170.10 - 210.40 |
0.6935 times |
Wed 30 April 2025 |
182.34 (1.23%) |
181.61 |
168.00 - 209.75 |
0.8577 times |
Fri 28 March 2025 |
180.12 (15.65%) |
155.11 |
145.75 - 191.75 |
0.9893 times |
Fri 28 February 2025 |
155.75 (-13.58%) |
182.41 |
155.00 - 189.87 |
0.5529 times |
Fri 31 January 2025 |
180.23 (-10.81%) |
201.01 |
161.50 - 214.45 |
0.6551 times |
Tue 31 December 2024 |
202.08 (7.27%) |
188.01 |
185.45 - 253.40 |
1.6117 times |

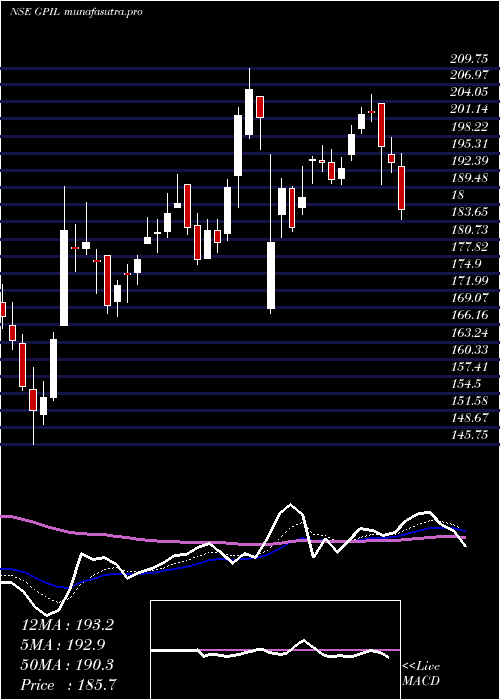
DMA SMA EMA moving averages of Godawari Power GPIL
DMA (daily moving average) of Godawari Power GPIL
| DMA period | DMA value | | 5 day DMA | 247.51 | | 12 day DMA | 245.26 | | 20 day DMA | 249.92 | | 35 day DMA | 249.69 | | 50 day DMA | 239.31 | | 100 day DMA | 213.63 | | 150 day DMA | 205.75 | | 200 day DMA | 199.67 | EMA (exponential moving average) of Godawari Power GPIL
| EMA period | EMA current | EMA prev | EMA prev2 | | 5 day EMA | 248.19 | 246.12 | 244.38 | | 12 day EMA | 247.35 | 246.44 | 245.87 | | 20 day EMA | 247.07 | 246.51 | 246.18 | | 35 day EMA | 241.51 | 240.87 | 240.36 | | 50 day EMA | 236.44 | 235.79 | 235.23 |
SMA (simple moving average) of Godawari Power GPIL
| SMA period | SMA current | SMA prev | SMA prev2 | | 5 day SMA | 247.51 | 245.24 | 244.03 | | 12 day SMA | 245.26 | 244.79 | 244.39 | | 20 day SMA | 249.92 | 250.38 | 250.93 | | 35 day SMA | 249.69 | 249.12 | 248.63 | | 50 day SMA | 239.31 | 238.08 | 237.08 | | 100 day SMA | 213.63 | 213.07 | 212.55 | | 150 day SMA | 205.75 | 205.25 | 204.79 | | 200 day SMA | 199.67 | 199.4 | 199.19 |
|
|
