GpEco GPECO_SM full analysis,charts,indicators,moving averages,SMA,DMA,EMA,ADX,MACD,RSIGp Eco GPECO_SM WideScreen charts, DMA,SMA,EMA technical analysis, forecast prediction, by indicators ADX,MACD,RSI,CCI NSE stock exchange
Daily price and charts and targets GpEco Strong Daily Stock price targets for GpEco GPECO_SM are 507.6 and 590.6 | Daily Target 1 | 444.73 | | Daily Target 2 | 487.47 | | Daily Target 3 | 527.73333333333 | | Daily Target 4 | 570.47 | | Daily Target 5 | 610.73 |
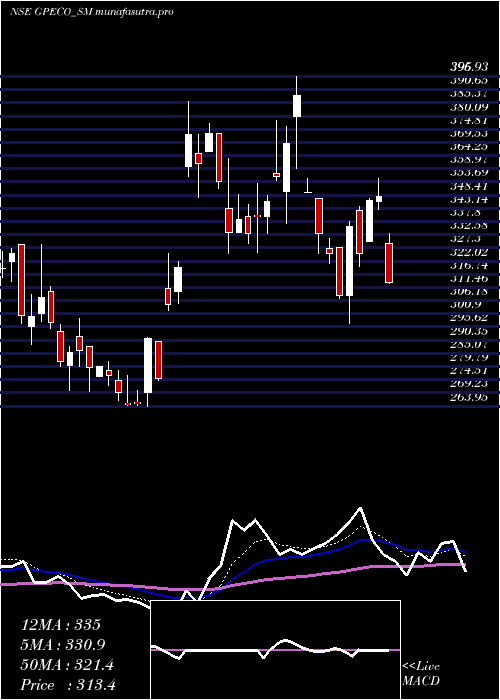
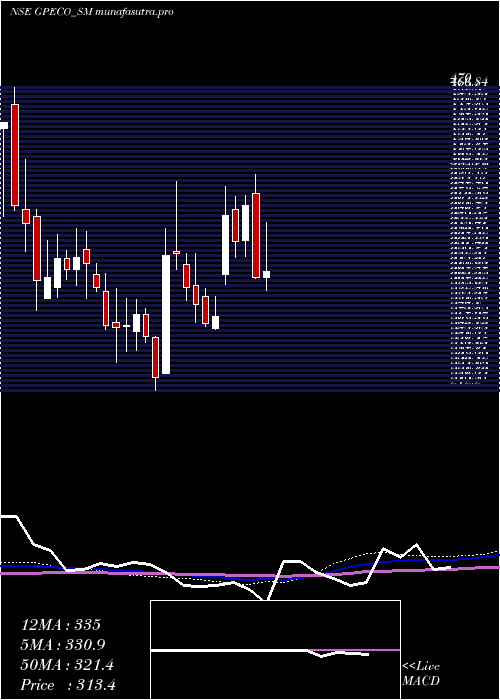
Daily price and volume Gp Eco
| Date |
Closing |
Open |
Range |
Volume |
Tue 28 October 2025 |
530.20 (6.8%) |
485.00 |
485.00 - 568.00 |
3.4435 times |
Mon 27 October 2025 |
496.45 (0.9%) |
499.50 |
478.00 - 499.50 |
0.5718 times |
Fri 24 October 2025 |
492.00 (-1.44%) |
500.00 |
486.25 - 500.00 |
0.0635 times |
Thu 23 October 2025 |
499.20 (1.62%) |
500.00 |
493.50 - 508.95 |
0.432 times |
Tue 21 October 2025 |
491.25 (1.38%) |
490.00 |
489.00 - 495.00 |
0.1779 times |
Mon 20 October 2025 |
484.55 (-1.11%) |
488.00 |
484.00 - 502.50 |
0.5845 times |
Fri 17 October 2025 |
490.00 (-4.13%) |
500.00 |
480.00 - 509.00 |
3.2529 times |
Thu 16 October 2025 |
511.10 (-3.2%) |
536.00 |
509.95 - 536.00 |
0.521 times |
Wed 15 October 2025 |
528.00 (1.59%) |
512.00 |
512.00 - 530.00 |
0.2287 times |
Tue 14 October 2025 |
519.75 (-3.93%) |
526.55 |
514.90 - 530.00 |
0.7243 times |
Mon 13 October 2025 |
541.00 (5.46%) |
586.95 |
530.00 - 586.95 |
1.3088 times |
Weekly price and charts GpEco Strong weekly Stock price targets for GpEco GPECO_SM are 504.1 and 594.1 | Weekly Target 1 | 435.4 | | Weekly Target 2 | 482.8 | | Weekly Target 3 | 525.4 | | Weekly Target 4 | 572.8 | | Weekly Target 5 | 615.4 |
Weekly price and volumes for Gp Eco
| Date |
Closing |
Open |
Range |
Volume |
Tue 28 October 2025 |
530.20 (7.76%) |
499.50 |
478.00 - 568.00 |
0.4401 times |
Fri 24 October 2025 |
492.00 (0.41%) |
488.00 |
484.00 - 508.95 |
0.1379 times |
Fri 17 October 2025 |
490.00 (-4.48%) |
586.95 |
480.00 - 586.95 |
0.6616 times |
Tue 08 July 2025 |
513.00 (5.84%) |
490.55 |
490.55 - 535.00 |
0.7925 times |
Fri 04 July 2025 |
484.70 (19.4%) |
419.90 |
415.00 - 495.00 |
2.727 times |
Fri 27 June 2025 |
405.95 (1.26%) |
392.20 |
371.00 - 422.00 |
1.8273 times |
Fri 20 June 2025 |
400.90 (6.71%) |
372.00 |
370.00 - 434.50 |
1.1894 times |
Fri 13 June 2025 |
375.70 (-0.99%) |
383.00 |
360.00 - 398.00 |
0.7577 times |
Fri 06 June 2025 |
379.45 (19.47%) |
312.00 |
309.05 - 408.00 |
1.2604 times |
Fri 30 May 2025 |
317.60 (1.34%) |
313.50 |
313.00 - 331.00 |
0.2061 times |
Fri 23 May 2025 |
313.40 (1.67%) |
308.25 |
297.00 - 355.00 |
0.9192 times |
Monthly price and charts GpEco Strong monthly Stock price targets for GpEco GPECO_SM are 449.63 and 558.58 | Monthly Target 1 | 422.77 | | Monthly Target 2 | 476.48 | | Monthly Target 3 | 531.71666666667 | | Monthly Target 4 | 585.43 | | Monthly Target 5 | 640.67 |
Monthly price and volumes Gp Eco
| Date |
Closing |
Open |
Range |
Volume |
Tue 28 October 2025 |
530.20 (3.35%) |
586.95 |
478.00 - 586.95 |
0.4079 times |
Tue 08 July 2025 |
513.00 (16.02%) |
461.00 |
440.10 - 535.00 |
0.8309 times |
Mon 30 June 2025 |
442.15 (39.22%) |
312.00 |
309.05 - 458.70 |
1.984 times |
Fri 30 May 2025 |
317.60 (-4.71%) |
333.30 |
297.00 - 396.00 |
1.1214 times |
Wed 30 April 2025 |
333.30 (21.2%) |
311.00 |
302.20 - 386.00 |
0.5 times |
Thu 05 December 2024 |
275.00 (2.12%) |
265.05 |
263.95 - 291.60 |
0.3254 times |
Fri 29 November 2024 |
269.30 (-16.03%) |
335.00 |
266.00 - 389.95 |
0.9931 times |
Thu 31 October 2024 |
320.70 (20.68%) |
265.00 |
212.20 - 349.80 |
1.1984 times |
Mon 30 September 2024 |
265.75 (-18.23%) |
331.80 |
236.10 - 347.00 |
1.3538 times |
Fri 30 August 2024 |
325.00 (-4.73%) |
342.00 |
280.00 - 350.00 |
1.2851 times |
Wed 31 July 2024 |
341.15 (0%) |
435.00 |
330.00 - 470.00 |
3.4922 times |

DMA SMA EMA moving averages of Gp Eco GPECO_SM
DMA (daily moving average) of Gp Eco GPECO_SM
| DMA period | DMA value | | 5 day DMA | 501.82 | | 12 day DMA | 508.04 | | 20 day DMA | 485.19 | | 35 day DMA | 444.43 | | 50 day DMA | 408.9 | | 100 day DMA | 358.62 | | 150 day DMA | 337.03 | | 200 day DMA | | EMA (exponential moving average) of Gp Eco GPECO_SM
| EMA period | EMA current | EMA prev | EMA prev2 | | 5 day EMA | 507.35 | 495.92 | 495.65 | | 12 day EMA | 497.44 | 491.49 | 490.59 | | 20 day EMA | 481.43 | 476.3 | 474.18 | | 35 day EMA | 450.09 | 445.37 | 442.36 | | 50 day EMA | 414.16 | 409.43 | 405.88 |
SMA (simple moving average) of Gp Eco GPECO_SM
| SMA period | SMA current | SMA prev | SMA prev2 | | 5 day SMA | 501.82 | 492.69 | 491.4 | | 12 day SMA | 508.04 | 507.48 | 506.5 | | 20 day SMA | 485.19 | 478.15 | 472.57 | | 35 day SMA | 444.43 | 438.81 | 433.71 | | 50 day SMA | 408.9 | 404.96 | 402.01 | | 100 day SMA | 358.62 | 356.04 | 353.71 | | 150 day SMA | 337.03 | 335.6 | 334.32 | | 200 day SMA |
|
|
