GoldstoneTechnologies GOLDTECH full analysis,charts,indicators,moving averages,SMA,DMA,EMA,ADX,MACD,RSIGoldstone Technologies GOLDTECH WideScreen charts, DMA,SMA,EMA technical analysis, forecast prediction, by indicators ADX,MACD,RSI,CCI NSE stock exchange
operates under IT Consulting & Software sector
Daily price and charts and targets GoldstoneTechnologies Strong Daily Stock price targets for GoldstoneTechnologies GOLDTECH are 57.44 and 59.79 | Daily Target 1 | 55.6 | | Daily Target 2 | 56.92 | | Daily Target 3 | 57.95 | | Daily Target 4 | 59.27 | | Daily Target 5 | 60.3 |
Daily price and volume Goldstone Technologies
| Date |
Closing |
Open |
Range |
Volume |
Mon 27 October 2025 |
58.24 (1.75%) |
58.10 |
56.63 - 58.98 |
0.694 times |
Fri 24 October 2025 |
57.24 (0.83%) |
57.98 |
56.00 - 57.98 |
0.5108 times |
Thu 23 October 2025 |
56.77 (1.14%) |
58.49 |
55.00 - 58.49 |
2.0335 times |
Tue 21 October 2025 |
56.13 (-1.84%) |
57.18 |
53.90 - 57.48 |
0.9853 times |
Mon 20 October 2025 |
57.18 (0.76%) |
56.75 |
55.80 - 61.74 |
1.2534 times |
Fri 17 October 2025 |
56.75 (-4.53%) |
60.50 |
55.01 - 60.83 |
1.6844 times |
Thu 16 October 2025 |
59.44 (-0.07%) |
59.77 |
58.65 - 61.08 |
0.675 times |
Wed 15 October 2025 |
59.48 (-0.37%) |
59.70 |
54.98 - 60.69 |
1.1321 times |
Tue 14 October 2025 |
59.70 (-0.62%) |
60.07 |
59.01 - 61.99 |
0.7849 times |
Mon 13 October 2025 |
60.07 (-0.92%) |
62.50 |
59.52 - 62.50 |
0.2466 times |
Fri 10 October 2025 |
60.63 (0.53%) |
60.00 |
60.00 - 61.57 |
0.6305 times |
Weekly price and charts GoldstoneTechnologies Strong weekly Stock price targets for GoldstoneTechnologies GOLDTECH are 57.44 and 59.79 | Weekly Target 1 | 55.6 | | Weekly Target 2 | 56.92 | | Weekly Target 3 | 57.95 | | Weekly Target 4 | 59.27 | | Weekly Target 5 | 60.3 |
Weekly price and volumes for Goldstone Technologies
| Date |
Closing |
Open |
Range |
Volume |
Mon 27 October 2025 |
58.24 (1.75%) |
58.10 |
56.63 - 58.98 |
0.1222 times |
Fri 24 October 2025 |
57.24 (0.86%) |
56.75 |
53.90 - 61.74 |
0.8422 times |
Fri 17 October 2025 |
56.75 (-6.4%) |
62.50 |
54.98 - 62.50 |
0.7964 times |
Fri 10 October 2025 |
60.63 (-5.24%) |
62.61 |
58.99 - 64.00 |
1.1318 times |
Fri 03 October 2025 |
63.98 (3.56%) |
64.80 |
56.98 - 64.80 |
0.7213 times |
Fri 26 September 2025 |
61.78 (-9.07%) |
69.40 |
61.20 - 69.40 |
1.7051 times |
Fri 19 September 2025 |
67.94 (1.37%) |
68.49 |
65.01 - 72.02 |
1.692 times |
Fri 12 September 2025 |
67.02 (-0.09%) |
67.36 |
66.12 - 70.20 |
1.249 times |
Fri 05 September 2025 |
67.08 (1.02%) |
66.05 |
66.05 - 72.50 |
1.2164 times |
Fri 29 August 2025 |
66.40 (-4.78%) |
72.00 |
66.05 - 72.00 |
0.5236 times |
Fri 22 August 2025 |
69.73 (-1.44%) |
72.30 |
69.10 - 76.90 |
1.0186 times |
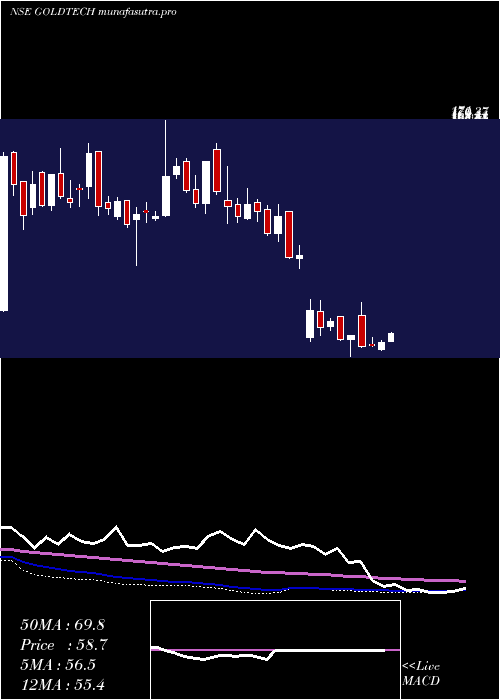
Monthly price and charts GoldstoneTechnologies Strong monthly Stock price targets for GoldstoneTechnologies GOLDTECH are 50.7 and 61.45 | Monthly Target 1 | 48.18 | | Monthly Target 2 | 53.21 | | Monthly Target 3 | 58.93 | | Monthly Target 4 | 63.96 | | Monthly Target 5 | 69.68 |
Monthly price and volumes Goldstone Technologies
| Date |
Closing |
Open |
Range |
Volume |
Mon 27 October 2025 |
58.24 (-5.07%) |
63.00 |
53.90 - 64.65 |
0.444 times |
Tue 30 September 2025 |
61.35 (-7.61%) |
66.05 |
60.30 - 72.50 |
0.8081 times |
Fri 29 August 2025 |
66.40 (-12.92%) |
76.01 |
66.05 - 78.20 |
0.5558 times |
Thu 31 July 2025 |
76.25 (3.49%) |
76.80 |
64.97 - 80.44 |
1.0854 times |
Mon 30 June 2025 |
73.68 (5.82%) |
70.50 |
63.00 - 76.70 |
0.6838 times |
Fri 30 May 2025 |
69.63 (7.5%) |
64.02 |
57.00 - 77.77 |
0.884 times |
Wed 30 April 2025 |
64.77 (24.8%) |
52.90 |
49.76 - 68.49 |
0.9401 times |
Fri 28 March 2025 |
51.90 (-15.87%) |
62.00 |
46.55 - 74.83 |
2.2432 times |
Fri 28 February 2025 |
61.69 (-38.27%) |
56.51 |
54.16 - 76.49 |
0.6394 times |
Wed 25 September 2024 |
99.94 (-18.58%) |
124.00 |
93.02 - 126.90 |
1.7161 times |
Fri 30 August 2024 |
122.74 (-11.19%) |
140.95 |
116.41 - 147.00 |
1.4918 times |

DMA SMA EMA moving averages of Goldstone Technologies GOLDTECH
DMA (daily moving average) of Goldstone Technologies GOLDTECH
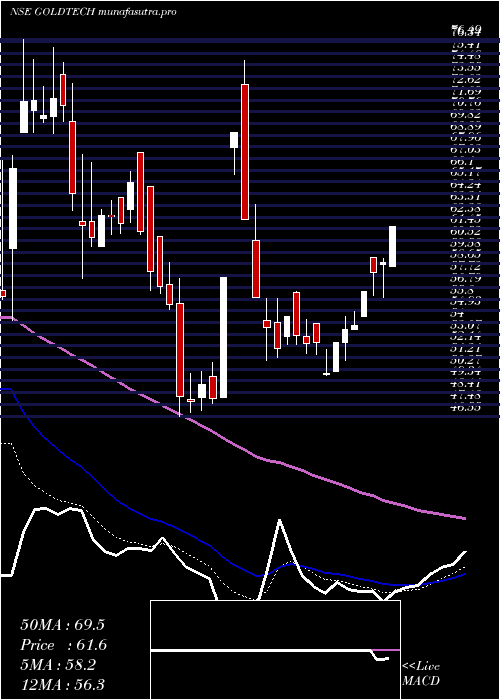
| DMA period | DMA value | | 5 day DMA | 57.11 | | 12 day DMA | 58.5 | | 20 day DMA | 59.93 | | 35 day DMA | 62.93 | | 50 day DMA | 64.73 | | 100 day DMA | 67.78 | | 150 day DMA | 65.98 | | 200 day DMA | 73.14 | EMA (exponential moving average) of Goldstone Technologies GOLDTECH
| EMA period | EMA current | EMA prev | EMA prev2 | | 5 day EMA | 57.6 | 57.28 | 57.3 | | 12 day EMA | 58.62 | 58.69 | 58.95 | | 20 day EMA | 60 | 60.19 | 60.5 | | 35 day EMA | 62.16 | 62.39 | 62.69 | | 50 day EMA | 64.45 | 64.7 | 65 |
SMA (simple moving average) of Goldstone Technologies GOLDTECH
| SMA period | SMA current | SMA prev | SMA prev2 | | 5 day SMA | 57.11 | 56.81 | 57.25 | | 12 day SMA | 58.5 | 58.69 | 59.14 | | 20 day SMA | 59.93 | 60.23 | 60.7 | | 35 day SMA | 62.93 | 63.2 | 63.48 | | 50 day SMA | 64.73 | 64.94 | 65.19 | | 100 day SMA | 67.78 | 67.88 | 68 | | 150 day SMA | 65.98 | 65.91 | 65.85 | | 200 day SMA | 73.14 | 73.47 | 73.8 |
|
|
