GoldstarPower GOLDSTAR_SM full analysis,charts,indicators,moving averages,SMA,DMA,EMA,ADX,MACD,RSIGoldstar Power GOLDSTAR_SM WideScreen charts, DMA,SMA,EMA technical analysis, forecast prediction, by indicators ADX,MACD,RSI,CCI NSE stock exchange
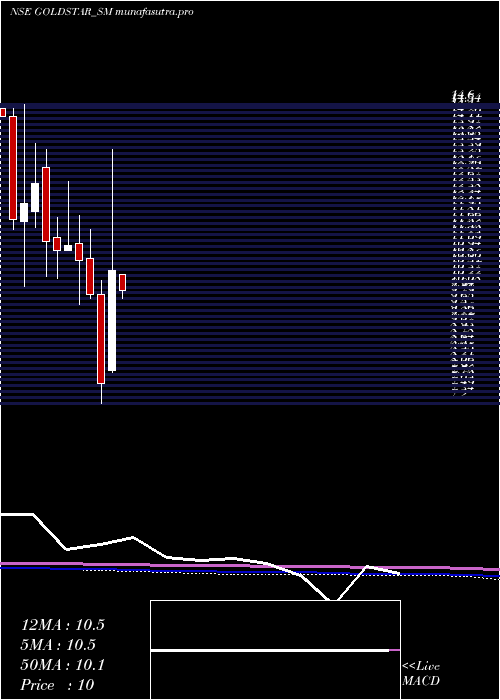
Daily price and charts and targets GoldstarPower Strong Daily Stock price targets for GoldstarPower GOLDSTAR_SM are 8.08 and 8.38 | Daily Target 1 | 7.83 | | Daily Target 2 | 8.02 | | Daily Target 3 | 8.1333333333333 | | Daily Target 4 | 8.32 | | Daily Target 5 | 8.43 |
Daily price and volume Goldstar Power
| Date |
Closing |
Open |
Range |
Volume |
Tue 28 October 2025 |
8.20 (3.8%) |
7.95 |
7.95 - 8.25 |
0.2963 times |
Mon 27 October 2025 |
7.90 (-2.47%) |
7.90 |
7.90 - 7.90 |
0.0741 times |
Fri 24 October 2025 |
8.10 (-0.61%) |
8.15 |
8.10 - 8.15 |
0.2222 times |
Thu 23 October 2025 |
8.15 (-2.4%) |
8.35 |
8.05 - 8.35 |
0.2963 times |
Tue 21 October 2025 |
8.35 (3.73%) |
8.35 |
8.35 - 8.35 |
0.2222 times |
Mon 20 October 2025 |
8.05 (-1.23%) |
8.10 |
7.80 - 8.10 |
0.3704 times |
Fri 17 October 2025 |
8.15 (-4.12%) |
8.35 |
8.15 - 8.40 |
0.2963 times |
Thu 16 October 2025 |
8.50 (0%) |
8.20 |
8.20 - 8.50 |
4 times |
Wed 15 October 2025 |
8.50 (0%) |
8.50 |
8.50 - 8.50 |
0.0741 times |
Tue 14 October 2025 |
8.50 (0.59%) |
8.80 |
8.20 - 8.80 |
4.1481 times |
Mon 13 October 2025 |
8.45 (0%) |
8.45 |
8.45 - 8.45 |
0.1481 times |
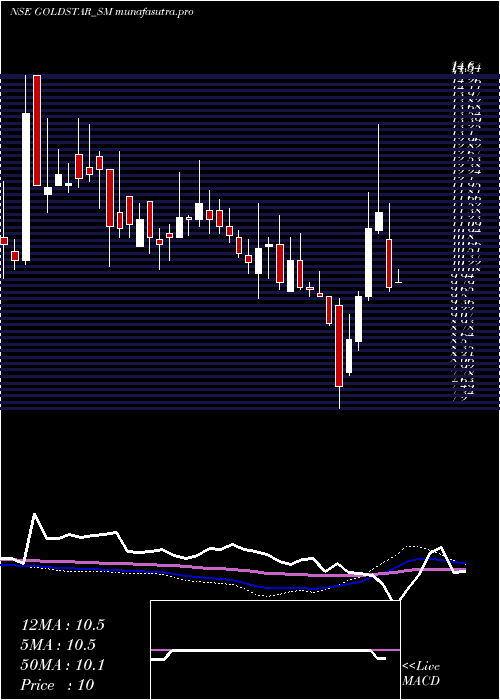
Weekly price and charts GoldstarPower Strong weekly Stock price targets for GoldstarPower GOLDSTAR_SM are 8.05 and 8.4 | Weekly Target 1 | 7.77 | | Weekly Target 2 | 7.98 | | Weekly Target 3 | 8.1166666666667 | | Weekly Target 4 | 8.33 | | Weekly Target 5 | 8.47 |
Weekly price and volumes for Goldstar Power
| Date |
Closing |
Open |
Range |
Volume |
Tue 28 October 2025 |
8.20 (1.23%) |
7.90 |
7.90 - 8.25 |
0.1433 times |
Fri 24 October 2025 |
8.10 (-0.61%) |
8.10 |
7.80 - 8.35 |
0.4298 times |
Fri 17 October 2025 |
8.15 (-3.55%) |
8.45 |
8.15 - 8.80 |
3.3524 times |
Fri 10 October 2025 |
8.45 (-0.59%) |
8.25 |
8.25 - 8.55 |
0.3725 times |
Fri 03 October 2025 |
8.50 (-5.03%) |
8.95 |
8.30 - 8.95 |
1.9484 times |
Fri 26 September 2025 |
8.95 (0.56%) |
8.80 |
8.70 - 9.15 |
0.6017 times |
Fri 19 September 2025 |
8.90 (-0.56%) |
8.90 |
8.85 - 9.00 |
0.2006 times |
Fri 12 September 2025 |
8.95 (-2.19%) |
9.15 |
8.75 - 9.15 |
0.3725 times |
Fri 05 September 2025 |
9.15 (2.81%) |
8.75 |
8.45 - 9.15 |
2.2063 times |
Fri 29 August 2025 |
8.90 (0%) |
9.25 |
8.70 - 9.25 |
0.3725 times |
Fri 22 August 2025 |
8.90 (-1.11%) |
9.00 |
8.75 - 9.00 |
0.6877 times |
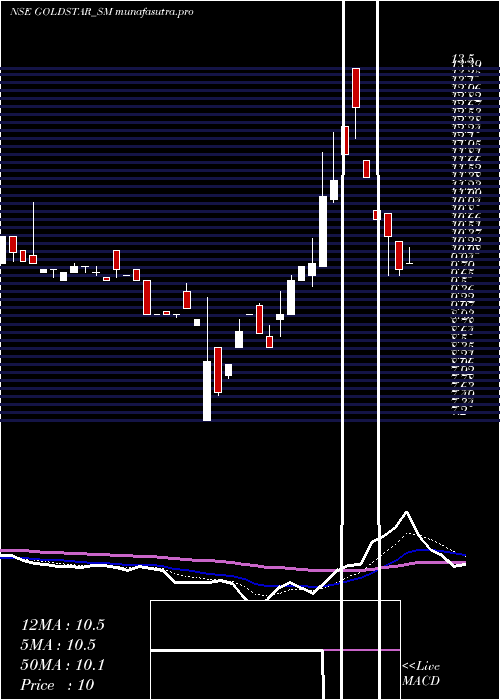
Monthly price and charts GoldstarPower Strong monthly Stock price targets for GoldstarPower GOLDSTAR_SM are 7.5 and 8.5 | Monthly Target 1 | 7.27 | | Monthly Target 2 | 7.73 | | Monthly Target 3 | 8.2666666666667 | | Monthly Target 4 | 8.73 | | Monthly Target 5 | 9.27 |
Monthly price and volumes Goldstar Power
| Date |
Closing |
Open |
Range |
Volume |
Tue 28 October 2025 |
8.20 (-7.34%) |
8.55 |
7.80 - 8.80 |
1.4306 times |
Tue 30 September 2025 |
8.85 (-0.56%) |
8.75 |
8.45 - 9.15 |
0.9028 times |
Fri 29 August 2025 |
8.90 (-13.17%) |
9.10 |
8.70 - 9.25 |
0.2986 times |
Thu 08 May 2025 |
10.25 (-2.38%) |
10.40 |
9.80 - 10.40 |
0.1319 times |
Tue 29 April 2025 |
10.50 (36.36%) |
8.00 |
7.95 - 13.50 |
1.2222 times |
Fri 28 March 2025 |
7.70 (-22.22%) |
9.90 |
7.20 - 10.25 |
0.9167 times |
Fri 28 February 2025 |
9.90 (-7.91%) |
10.80 |
9.80 - 11.50 |
1.8194 times |
Fri 31 January 2025 |
10.75 (-3.15%) |
11.15 |
9.65 - 11.85 |
1.0208 times |
Tue 31 December 2024 |
11.10 (0.91%) |
11.00 |
11.00 - 12.70 |
1.2153 times |
Fri 29 November 2024 |
11.00 (-1.79%) |
11.30 |
10.30 - 11.80 |
1.0417 times |
Thu 31 October 2024 |
11.20 (-11.46%) |
13.05 |
10.35 - 13.50 |
1.5208 times |
DMA SMA EMA moving averages of Goldstar Power GOLDSTAR_SM
DMA (daily moving average) of Goldstar Power GOLDSTAR_SM
| DMA period | DMA value | | 5 day DMA | 8.14 | | 12 day DMA | 8.28 | | 20 day DMA | 8.43 | | 35 day DMA | 8.64 | | 50 day DMA | 8.79 | | 100 day DMA | 9.36 | | 150 day DMA | 9.94 | | 200 day DMA | 10.44 | EMA (exponential moving average) of Goldstar Power GOLDSTAR_SM
| EMA period | EMA current | EMA prev | EMA prev2 | | 5 day EMA | 8.13 | 8.1 | 8.2 | | 12 day EMA | 8.27 | 8.28 | 8.35 | | 20 day EMA | 8.42 | 8.44 | 8.5 | | 35 day EMA | 8.67 | 8.7 | 8.75 | | 50 day EMA | 8.95 | 8.98 | 9.02 |
SMA (simple moving average) of Goldstar Power GOLDSTAR_SM
| SMA period | SMA current | SMA prev | SMA prev2 | | 5 day SMA | 8.14 | 8.11 | 8.16 | | 12 day SMA | 8.28 | 8.3 | 8.35 | | 20 day SMA | 8.43 | 8.47 | 8.54 | | 35 day SMA | 8.64 | 8.66 | 8.69 | | 50 day SMA | 8.79 | 8.84 | 8.89 | | 100 day SMA | 9.36 | 9.39 | 9.41 | | 150 day SMA | 9.94 | 9.96 | 9.98 | | 200 day SMA | 10.44 | 10.46 | 10.48 |
|
|
