UtiAsset GOLDSHARE full analysis,charts,indicators,moving averages,SMA,DMA,EMA,ADX,MACD,RSIUti Asset GOLDSHARE WideScreen charts, DMA,SMA,EMA technical analysis, forecast prediction, by indicators ADX,MACD,RSI,CCI NSE stock exchange
Daily price and charts and targets UtiAsset Strong Daily Stock price targets for UtiAsset GOLDSHARE are 100.1 and 102.55 | Daily Target 1 | 98.12 | | Daily Target 2 | 99.63 | | Daily Target 3 | 100.56666666667 | | Daily Target 4 | 102.08 | | Daily Target 5 | 103.02 |
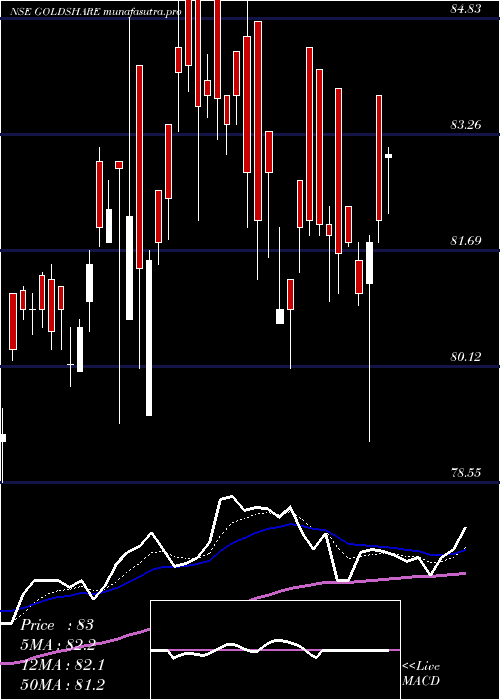
Daily price and volume Uti Asset
| Date |
Closing |
Open |
Range |
Volume |
Wed 29 October 2025 |
101.15 (2.9%) |
99.05 |
99.05 - 101.50 |
0.5484 times |
Tue 28 October 2025 |
98.30 (-3.3%) |
101.15 |
97.75 - 101.65 |
0.9222 times |
Mon 27 October 2025 |
101.65 (-0.54%) |
103.70 |
101.35 - 103.70 |
0.5574 times |
Fri 24 October 2025 |
102.20 (-0.87%) |
105.65 |
100.55 - 105.65 |
1.0425 times |
Thu 23 October 2025 |
103.10 (-3.96%) |
110.00 |
95.85 - 110.00 |
1.4645 times |
Tue 21 October 2025 |
107.35 (0.14%) |
109.85 |
106.95 - 110.90 |
0.3062 times |
Mon 20 October 2025 |
107.20 (-2.23%) |
109.00 |
106.00 - 109.00 |
1.1469 times |
Fri 17 October 2025 |
109.65 (2.48%) |
108.95 |
108.65 - 110.15 |
1.2772 times |
Thu 16 October 2025 |
107.00 (0%) |
108.00 |
106.00 - 108.30 |
1.2367 times |
Wed 15 October 2025 |
107.00 (-0.14%) |
108.30 |
106.80 - 108.80 |
1.498 times |
Tue 14 October 2025 |
107.15 (2.83%) |
106.80 |
104.70 - 109.45 |
1.2636 times |
Weekly price and charts UtiAsset Strong weekly Stock price targets for UtiAsset GOLDSHARE are 96.48 and 102.43 | Weekly Target 1 | 94.92 | | Weekly Target 2 | 98.03 | | Weekly Target 3 | 100.86666666667 | | Weekly Target 4 | 103.98 | | Weekly Target 5 | 106.82 |
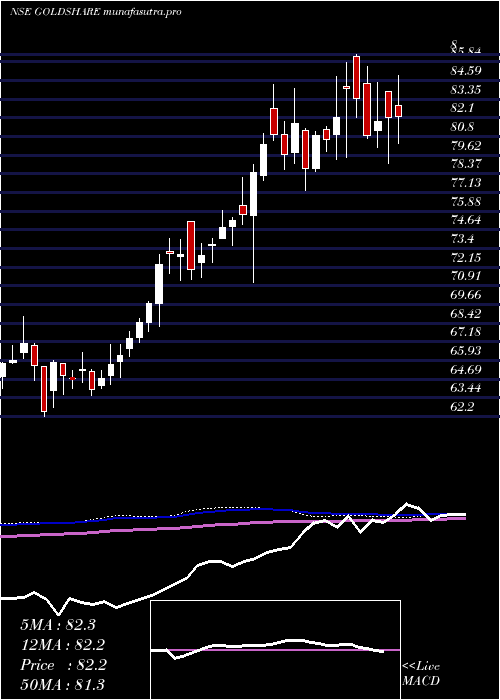
Weekly price and volumes for Uti Asset
| Date |
Closing |
Open |
Range |
Volume |
Wed 29 October 2025 |
101.15 (-1.03%) |
103.70 |
97.75 - 103.70 |
0.5658 times |
Fri 24 October 2025 |
102.20 (-6.79%) |
109.00 |
95.85 - 110.90 |
1.1048 times |
Fri 17 October 2025 |
109.65 (7.29%) |
104.30 |
102.85 - 110.15 |
1.8537 times |
Fri 10 October 2025 |
102.20 (3.81%) |
100.90 |
98.55 - 103.60 |
1.529 times |
Fri 03 October 2025 |
98.45 (2.93%) |
98.00 |
96.20 - 100.25 |
1.0398 times |
Fri 26 September 2025 |
95.65 (3.29%) |
94.90 |
92.75 - 98.55 |
1.101 times |
Fri 19 September 2025 |
92.60 (0.16%) |
94.75 |
90.00 - 96.00 |
0.9426 times |
Fri 12 September 2025 |
92.45 (2.72%) |
92.25 |
90.05 - 97.25 |
1.0737 times |
Fri 05 September 2025 |
90.00 (4.23%) |
87.60 |
85.70 - 91.55 |
0.5089 times |
Fri 29 August 2025 |
86.35 (3.17%) |
85.00 |
82.45 - 87.60 |
0.2807 times |
Fri 22 August 2025 |
83.70 (-0.71%) |
84.30 |
81.35 - 86.10 |
0.291 times |
Monthly price and charts UtiAsset Strong monthly Stock price targets for UtiAsset GOLDSHARE are 98.5 and 113.55 | Monthly Target 1 | 87.58 | | Monthly Target 2 | 94.37 | | Monthly Target 3 | 102.63333333333 | | Monthly Target 4 | 109.42 | | Monthly Target 5 | 117.68 |
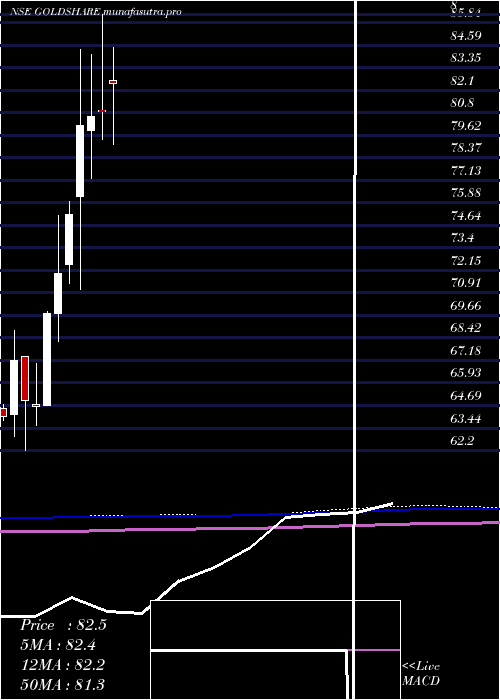
Monthly price and volumes Uti Asset
| Date |
Closing |
Open |
Range |
Volume |
Wed 29 October 2025 |
101.15 (3.9%) |
100.25 |
95.85 - 110.90 |
1.9863 times |
Tue 30 September 2025 |
97.35 (12.74%) |
87.60 |
85.70 - 99.55 |
1.4797 times |
Fri 29 August 2025 |
86.35 (3.66%) |
85.35 |
81.35 - 87.60 |
0.4604 times |
Thu 31 July 2025 |
83.30 (2.97%) |
82.65 |
79.10 - 85.90 |
0.6143 times |
Mon 30 June 2025 |
80.90 (0.31%) |
81.00 |
79.35 - 86.30 |
0.8663 times |
Fri 30 May 2025 |
80.65 (0.62%) |
79.90 |
77.25 - 84.05 |
1.2453 times |
Wed 30 April 2025 |
80.15 (6.51%) |
76.25 |
71.10 - 84.35 |
1.5563 times |
Fri 28 March 2025 |
75.25 (4.51%) |
72.45 |
71.45 - 75.95 |
0.6653 times |
Fri 28 February 2025 |
72.00 (3.23%) |
69.75 |
68.20 - 75.20 |
0.802 times |
Fri 31 January 2025 |
69.75 (7.89%) |
64.70 |
64.70 - 69.85 |
0.3241 times |
Tue 31 December 2024 |
64.65 (-0.46%) |
64.75 |
63.60 - 67.00 |
0.2608 times |
DMA SMA EMA moving averages of Uti Asset GOLDSHARE
DMA (daily moving average) of Uti Asset GOLDSHARE
| DMA period | DMA value | | 5 day DMA | 101.28 | | 12 day DMA | 104.66 | | 20 day DMA | 103.06 | | 35 day DMA | 99.2 | | 50 day DMA | 95.34 | | 100 day DMA | 89.17 | | 150 day DMA | 85.86 | | 200 day DMA | 82.15 | EMA (exponential moving average) of Uti Asset GOLDSHARE
| EMA period | EMA current | EMA prev | EMA prev2 | | 5 day EMA | 101.62 | 101.85 | 103.62 | | 12 day EMA | 102.72 | 103 | 103.86 | | 20 day EMA | 101.85 | 101.92 | 102.3 | | 35 day EMA | 98.86 | 98.72 | 98.74 | | 50 day EMA | 95.03 | 94.78 | 94.64 |
SMA (simple moving average) of Uti Asset GOLDSHARE
| SMA period | SMA current | SMA prev | SMA prev2 | | 5 day SMA | 101.28 | 102.52 | 104.3 | | 12 day SMA | 104.66 | 104.75 | 105.16 | | 20 day SMA | 103.06 | 102.88 | 102.75 | | 35 day SMA | 99.2 | 98.92 | 98.68 | | 50 day SMA | 95.34 | 95 | 94.72 | | 100 day SMA | 89.17 | 88.99 | 88.83 | | 150 day SMA | 85.86 | 85.69 | 85.53 | | 200 day SMA | 82.15 | 81.97 | 81.8 |
|
|
