IciciPrudential GOLDIETF full analysis,charts,indicators,moving averages,SMA,DMA,EMA,ADX,MACD,RSIIcici Prudential GOLDIETF WideScreen charts, DMA,SMA,EMA technical analysis, forecast prediction, by indicators ADX,MACD,RSI,CCI NSE stock exchange
Daily price and charts and targets IciciPrudential Strong Daily Stock price targets for IciciPrudential GOLDIETF are 109.4 and 110.27 | Daily Target 1 | 109.21 | | Daily Target 2 | 109.59 | | Daily Target 3 | 110.08333333333 | | Daily Target 4 | 110.46 | | Daily Target 5 | 110.95 |
Daily price and volume Icici Prudential
| Date |
Closing |
Open |
Range |
Volume |
Wed 10 December 2025 |
109.96 (-0.05%) |
110.57 |
109.71 - 110.58 |
0.7005 times |
Tue 09 December 2025 |
110.01 (-0.66%) |
110.39 |
109.10 - 110.50 |
1.1363 times |
Mon 08 December 2025 |
110.74 (0.09%) |
111.50 |
109.52 - 112.18 |
1.9822 times |
Fri 05 December 2025 |
110.64 (0.81%) |
109.75 |
109.43 - 110.70 |
1.3234 times |
Thu 04 December 2025 |
109.75 (-0.33%) |
110.93 |
109.36 - 110.93 |
0.9201 times |
Wed 03 December 2025 |
110.11 (0.8%) |
110.02 |
108.57 - 110.87 |
1.1037 times |
Tue 02 December 2025 |
109.24 (-1.19%) |
110.40 |
109.06 - 110.40 |
0.7239 times |
Mon 01 December 2025 |
110.56 (2.29%) |
109.32 |
109.32 - 111.09 |
1.0006 times |
Fri 28 November 2025 |
108.09 (0.39%) |
108.24 |
107.87 - 108.46 |
0.6772 times |
Thu 27 November 2025 |
107.67 (-0.01%) |
107.64 |
107.18 - 107.94 |
0.432 times |
Wed 26 November 2025 |
107.68 (0.68%) |
107.56 |
107.55 - 108.02 |
0.9334 times |
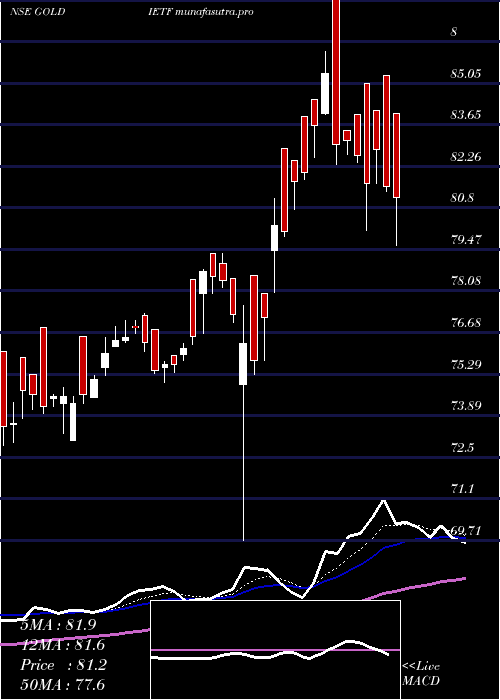
Weekly price and charts IciciPrudential Strong weekly Stock price targets for IciciPrudential GOLDIETF are 107.99 and 111.07 | Weekly Target 1 | 107.33 | | Weekly Target 2 | 108.65 | | Weekly Target 3 | 110.41333333333 | | Weekly Target 4 | 111.73 | | Weekly Target 5 | 113.49 |
Weekly price and volumes for Icici Prudential
| Date |
Closing |
Open |
Range |
Volume |
Wed 10 December 2025 |
109.96 (-0.61%) |
111.50 |
109.10 - 112.18 |
0.5509 times |
Fri 05 December 2025 |
110.64 (2.36%) |
109.32 |
108.57 - 111.09 |
0.7316 times |
Fri 28 November 2025 |
108.09 (2.42%) |
105.80 |
105.03 - 108.46 |
0.4579 times |
Fri 21 November 2025 |
105.54 (-1.63%) |
104.07 |
103.33 - 105.99 |
0.6084 times |
Fri 14 November 2025 |
107.29 (3.93%) |
104.98 |
103.75 - 109.40 |
0.6527 times |
Fri 07 November 2025 |
103.23 (-0.11%) |
103.83 |
102.12 - 104.03 |
0.6886 times |
Fri 31 October 2025 |
103.34 (-0.37%) |
103.60 |
99.61 - 104.91 |
1.0508 times |
Fri 24 October 2025 |
103.72 (-7.25%) |
110.40 |
95.53 - 114.00 |
1.3213 times |
Fri 17 October 2025 |
111.83 (7.51%) |
106.40 |
104.63 - 112.65 |
2.0044 times |
Fri 10 October 2025 |
104.02 (4.14%) |
102.30 |
98.80 - 105.70 |
1.9334 times |
Fri 03 October 2025 |
99.88 (2.57%) |
97.96 |
97.96 - 102.37 |
1.5969 times |
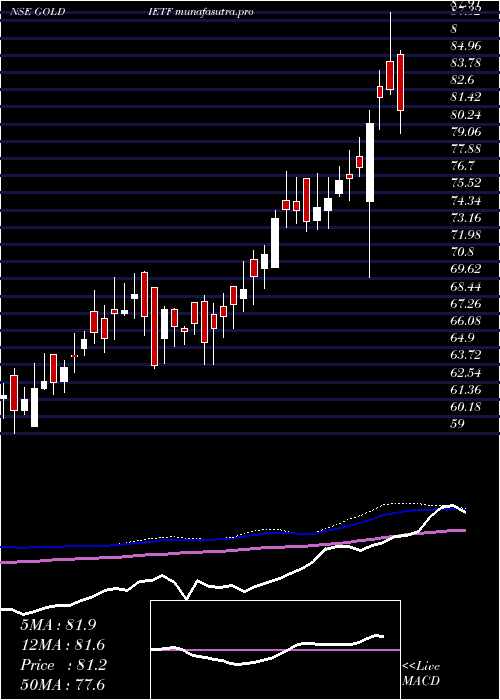
Monthly price and charts IciciPrudential Strong monthly Stock price targets for IciciPrudential GOLDIETF are 109.27 and 112.88 | Monthly Target 1 | 106.63 | | Monthly Target 2 | 108.29 | | Monthly Target 3 | 110.23666666667 | | Monthly Target 4 | 111.9 | | Monthly Target 5 | 113.85 |
Monthly price and volumes Icici Prudential
| Date |
Closing |
Open |
Range |
Volume |
Wed 10 December 2025 |
109.96 (1.73%) |
109.32 |
108.57 - 112.18 |
0.4935 times |
Fri 28 November 2025 |
108.09 (4.6%) |
103.83 |
102.12 - 109.40 |
0.9265 times |
Fri 31 October 2025 |
103.34 (3.79%) |
100.38 |
95.53 - 114.00 |
2.7065 times |
Tue 30 September 2025 |
99.57 (12.93%) |
89.18 |
88.67 - 102.50 |
1.7229 times |
Fri 29 August 2025 |
88.17 (3.9%) |
85.08 |
82.73 - 89.41 |
0.5484 times |
Thu 31 July 2025 |
84.86 (2.72%) |
83.02 |
81.26 - 88.14 |
0.5216 times |
Mon 30 June 2025 |
82.61 (0.43%) |
83.17 |
81.36 - 88.51 |
0.7857 times |
Fri 30 May 2025 |
82.26 (0.82%) |
84.04 |
78.59 - 85.63 |
0.6327 times |
Wed 30 April 2025 |
81.59 (6.6%) |
78.00 |
69.71 - 87.91 |
0.8148 times |
Fri 28 March 2025 |
76.54 (4.07%) |
73.60 |
73.01 - 78.45 |
0.8475 times |
Fri 28 February 2025 |
73.55 (3.18%) |
70.44 |
70.44 - 77.00 |
0.8765 times |
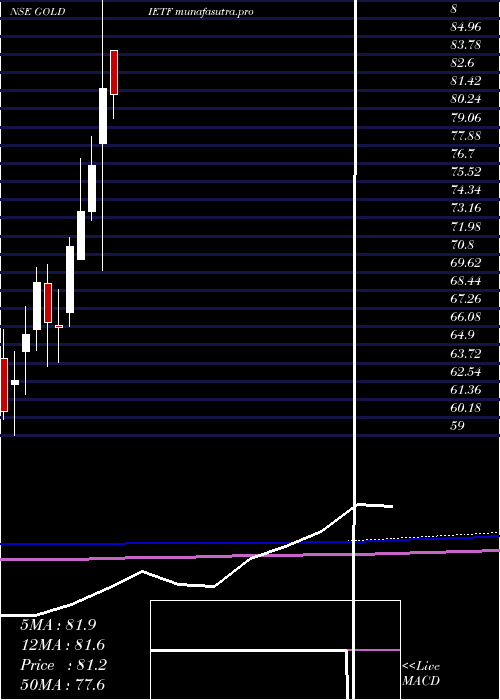
DMA SMA EMA moving averages of Icici Prudential GOLDIETF
DMA (daily moving average) of Icici Prudential GOLDIETF
| DMA period | DMA value | | 5 day DMA | 110.22 | | 12 day DMA | 109.28 | | 20 day DMA | 107.96 | | 35 day DMA | 106.3 | | 50 day DMA | 105.86 | | 100 day DMA | 97.45 | | 150 day DMA | 92.72 | | 200 day DMA | 88.98 | EMA (exponential moving average) of Icici Prudential GOLDIETF
| EMA period | EMA current | EMA prev | EMA prev2 | | 5 day EMA | 110.04 | 110.08 | 110.11 | | 12 day EMA | 109.19 | 109.05 | 108.88 | | 20 day EMA | 108.23 | 108.05 | 107.84 | | 35 day EMA | 106.9 | 106.72 | 106.53 | | 50 day EMA | 105.61 | 105.43 | 105.24 |
SMA (simple moving average) of Icici Prudential GOLDIETF
| SMA period | SMA current | SMA prev | SMA prev2 | | 5 day SMA | 110.22 | 110.25 | 110.1 | | 12 day SMA | 109.28 | 108.93 | 108.56 | | 20 day SMA | 107.96 | 107.78 | 107.62 | | 35 day SMA | 106.3 | 106.25 | 106.3 | | 50 day SMA | 105.86 | 105.61 | 105.36 | | 100 day SMA | 97.45 | 97.19 | 96.94 | | 150 day SMA | 92.72 | 92.54 | 92.37 | | 200 day SMA | 88.98 | 88.8 | 88.62 |
|
|
