GoldiamInternational GOLDIAM full analysis,charts,indicators,moving averages,SMA,DMA,EMA,ADX,MACD,RSIGoldiam International GOLDIAM WideScreen charts, DMA,SMA,EMA technical analysis, forecast prediction, by indicators ADX,MACD,RSI,CCI NSE stock exchange
operates under Other Apparels & Accessories sector
Daily price and charts and targets GoldiamInternational Strong Daily Stock price targets for GoldiamInternational GOLDIAM are 351.03 and 357.93 | Daily Target 1 | 349.42 | | Daily Target 2 | 352.63 | | Daily Target 3 | 356.31666666667 | | Daily Target 4 | 359.53 | | Daily Target 5 | 363.22 |
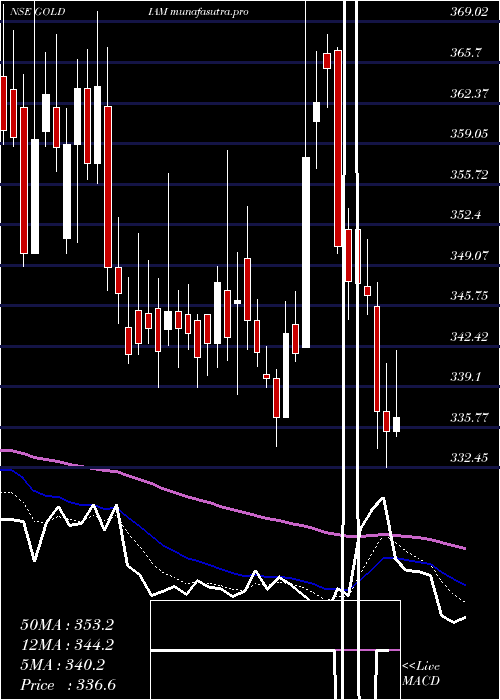
Daily price and volume Goldiam International
| Date |
Closing |
Open |
Range |
Volume |
Tue 28 October 2025 |
355.85 (-0.53%) |
359.35 |
353.10 - 360.00 |
0.5533 times |
Mon 27 October 2025 |
357.75 (0.63%) |
356.05 |
351.15 - 359.30 |
0.8326 times |
Fri 24 October 2025 |
355.50 (-2.63%) |
370.00 |
352.55 - 370.00 |
1.3864 times |
Thu 23 October 2025 |
365.10 (1.64%) |
370.00 |
362.25 - 380.40 |
2.1763 times |
Tue 21 October 2025 |
359.20 (0.48%) |
352.35 |
352.35 - 361.60 |
0.2004 times |
Mon 20 October 2025 |
357.50 (-0.15%) |
359.70 |
352.60 - 359.95 |
0.7108 times |
Fri 17 October 2025 |
358.05 (-1.53%) |
361.00 |
357.00 - 364.60 |
0.5968 times |
Thu 16 October 2025 |
363.60 (1.72%) |
359.95 |
358.55 - 365.50 |
0.8867 times |
Wed 15 October 2025 |
357.45 (-0.38%) |
357.60 |
356.25 - 364.40 |
1.007 times |
Tue 14 October 2025 |
358.80 (-3.34%) |
374.50 |
357.00 - 374.50 |
1.6498 times |
Mon 13 October 2025 |
371.20 (-0.44%) |
367.25 |
363.40 - 375.50 |
1.3695 times |
Weekly price and charts GoldiamInternational Strong weekly Stock price targets for GoldiamInternational GOLDIAM are 349.08 and 357.93 | Weekly Target 1 | 346.82 | | Weekly Target 2 | 351.33 | | Weekly Target 3 | 355.66666666667 | | Weekly Target 4 | 360.18 | | Weekly Target 5 | 364.52 |
Weekly price and volumes for Goldiam International
| Date |
Closing |
Open |
Range |
Volume |
Tue 28 October 2025 |
355.85 (0.1%) |
356.05 |
351.15 - 360.00 |
0.1359 times |
Fri 24 October 2025 |
355.50 (-0.71%) |
359.70 |
352.35 - 380.40 |
0.4388 times |
Fri 17 October 2025 |
358.05 (-3.97%) |
367.25 |
356.25 - 375.50 |
0.5404 times |
Fri 10 October 2025 |
372.85 (-4.4%) |
389.00 |
370.00 - 389.80 |
0.3956 times |
Fri 03 October 2025 |
390.00 (5.95%) |
372.00 |
358.00 - 398.05 |
0.6794 times |
Fri 26 September 2025 |
368.10 (-7.64%) |
398.50 |
362.85 - 398.50 |
1.0495 times |
Fri 19 September 2025 |
398.55 (-0.18%) |
399.90 |
385.00 - 410.85 |
1.2094 times |
Fri 12 September 2025 |
399.25 (-4.15%) |
419.00 |
394.95 - 425.65 |
1.3378 times |
Fri 05 September 2025 |
416.55 (14.74%) |
362.40 |
361.00 - 424.90 |
2.3677 times |
Fri 29 August 2025 |
363.05 (1.34%) |
361.25 |
340.00 - 376.50 |
1.8455 times |
Fri 22 August 2025 |
358.25 (-0.98%) |
368.00 |
340.35 - 378.00 |
2.5604 times |

Monthly price and charts GoldiamInternational Strong monthly Stock price targets for GoldiamInternational GOLDIAM are 332.6 and 374.4 | Monthly Target 1 | 324.85 | | Monthly Target 2 | 340.35 | | Monthly Target 3 | 366.65 | | Monthly Target 4 | 382.15 | | Monthly Target 5 | 408.45 |
Monthly price and volumes Goldiam International
| Date |
Closing |
Open |
Range |
Volume |
Tue 28 October 2025 |
355.85 (-7.8%) |
384.45 |
351.15 - 392.95 |
0.2522 times |
Tue 30 September 2025 |
385.95 (6.31%) |
362.40 |
358.00 - 425.65 |
0.8252 times |
Fri 29 August 2025 |
363.05 (6.02%) |
341.05 |
330.00 - 380.90 |
0.939 times |
Thu 31 July 2025 |
342.45 (-0.41%) |
345.00 |
307.00 - 374.00 |
0.3977 times |
Mon 30 June 2025 |
343.85 (-8.45%) |
375.60 |
339.05 - 377.80 |
0.3911 times |
Fri 30 May 2025 |
375.60 (2.41%) |
363.30 |
339.35 - 401.60 |
0.6394 times |
Wed 30 April 2025 |
366.75 (-2.32%) |
367.80 |
251.35 - 408.90 |
1.7824 times |
Fri 28 March 2025 |
375.45 (2.44%) |
361.00 |
339.10 - 431.50 |
0.8373 times |
Fri 28 February 2025 |
366.50 (-25.49%) |
519.00 |
345.05 - 563.00 |
1.7616 times |
Fri 31 January 2025 |
491.85 (27.42%) |
387.50 |
377.85 - 569.00 |
2.1741 times |
Tue 31 December 2024 |
386.00 (21.38%) |
318.00 |
317.00 - 454.75 |
1.121 times |

DMA SMA EMA moving averages of Goldiam International GOLDIAM
DMA (daily moving average) of Goldiam International GOLDIAM
| DMA period | DMA value | | 5 day DMA | 358.68 | | 12 day DMA | 361.07 | | 20 day DMA | 368.74 | | 35 day DMA | 378.32 | | 50 day DMA | 375.87 | | 100 day DMA | 362.81 | | 150 day DMA | 365.22 | | 200 day DMA | 384.35 | EMA (exponential moving average) of Goldiam International GOLDIAM
| EMA period | EMA current | EMA prev | EMA prev2 | | 5 day EMA | 358.02 | 359.1 | 359.78 | | 12 day EMA | 362.18 | 363.33 | 364.35 | | 20 day EMA | 366.35 | 367.45 | 368.47 | | 35 day EMA | 369.71 | 370.53 | 371.28 | | 50 day EMA | 373.14 | 373.85 | 374.51 |
SMA (simple moving average) of Goldiam International GOLDIAM
| SMA period | SMA current | SMA prev | SMA prev2 | | 5 day SMA | 358.68 | 359.01 | 359.07 | | 12 day SMA | 361.07 | 362.56 | 364.45 | | 20 day SMA | 368.74 | 369.35 | 370.03 | | 35 day SMA | 378.32 | 380.05 | 381.16 | | 50 day SMA | 375.87 | 376.1 | 376.25 | | 100 day SMA | 362.81 | 362.89 | 362.99 | | 150 day SMA | 365.22 | 365.62 | 365.96 | | 200 day SMA | 384.35 | 384.65 | 384.98 |
|
|
