GoldmanSachs GOLDBEES full analysis,charts,indicators,moving averages,SMA,DMA,EMA,ADX,MACD,RSIGoldman Sachs GOLDBEES WideScreen charts, DMA,SMA,EMA technical analysis, forecast prediction, by indicators ADX,MACD,RSI,CCI NSE stock exchange
Daily price and charts and targets GoldmanSachs Strong Daily Stock price targets for GoldmanSachs GOLDBEES are 105.79 and 106.54 | Daily Target 1 | 105.64 | | Daily Target 2 | 105.94 | | Daily Target 3 | 106.39333333333 | | Daily Target 4 | 106.69 | | Daily Target 5 | 107.14 |
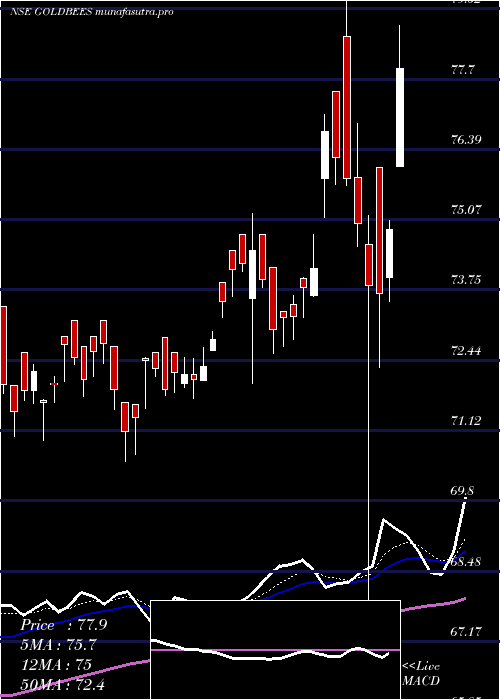
Daily price and volume Goldman Sachs
| Date |
Closing |
Open |
Range |
Volume |
Wed 10 December 2025 |
106.23 (-0.05%) |
106.85 |
106.10 - 106.85 |
0.8676 times |
Tue 09 December 2025 |
106.28 (-0.53%) |
106.76 |
105.50 - 106.76 |
0.9392 times |
Mon 08 December 2025 |
106.85 (-0.04%) |
106.77 |
106.11 - 106.96 |
1.0739 times |
Fri 05 December 2025 |
106.89 (0.92%) |
106.27 |
105.82 - 107.02 |
0.9402 times |
Thu 04 December 2025 |
105.92 (-0.55%) |
106.67 |
105.70 - 106.96 |
1.1156 times |
Wed 03 December 2025 |
106.51 (0.83%) |
106.25 |
106.24 - 106.70 |
1.0616 times |
Tue 02 December 2025 |
105.63 (-1.02%) |
106.65 |
105.39 - 106.65 |
1.0834 times |
Mon 01 December 2025 |
106.72 (2.01%) |
106.09 |
105.77 - 106.80 |
1.3546 times |
Fri 28 November 2025 |
104.62 (0.49%) |
104.60 |
104.31 - 104.98 |
0.7661 times |
Thu 27 November 2025 |
104.11 (-0.07%) |
104.10 |
103.84 - 104.40 |
0.7978 times |
Wed 26 November 2025 |
104.18 (0.7%) |
103.91 |
103.91 - 104.35 |
0.9469 times |
Weekly price and charts GoldmanSachs Strong weekly Stock price targets for GoldmanSachs GOLDBEES are 105.14 and 106.6 | Weekly Target 1 | 104.77 | | Weekly Target 2 | 105.5 | | Weekly Target 3 | 106.23 | | Weekly Target 4 | 106.96 | | Weekly Target 5 | 107.69 |
Weekly price and volumes for Goldman Sachs
| Date |
Closing |
Open |
Range |
Volume |
Wed 10 December 2025 |
106.23 (-0.62%) |
106.77 |
105.50 - 106.96 |
0.3865 times |
Fri 05 December 2025 |
106.89 (2.17%) |
106.09 |
105.39 - 107.02 |
0.7454 times |
Fri 28 November 2025 |
104.62 (2.57%) |
101.99 |
101.55 - 104.98 |
0.6079 times |
Fri 21 November 2025 |
102.00 (-1.74%) |
103.36 |
100.01 - 103.36 |
0.7162 times |
Fri 14 November 2025 |
103.81 (3.87%) |
101.19 |
100.46 - 105.46 |
0.8593 times |
Fri 07 November 2025 |
99.94 (-0.08%) |
100.02 |
99.03 - 100.70 |
0.4783 times |
Fri 31 October 2025 |
100.02 (-0.4%) |
100.75 |
96.60 - 101.21 |
1.3309 times |
Fri 24 October 2025 |
100.42 (-7.11%) |
106.90 |
95.55 - 108.21 |
1.5288 times |
Fri 17 October 2025 |
108.11 (7.39%) |
102.60 |
101.60 - 108.69 |
1.8287 times |
Fri 10 October 2025 |
100.67 (3.71%) |
98.20 |
97.35 - 102.60 |
1.5179 times |
Fri 03 October 2025 |
97.07 (3.02%) |
94.80 |
94.34 - 97.79 |
0.9197 times |

Monthly price and charts GoldmanSachs Strong monthly Stock price targets for GoldmanSachs GOLDBEES are 105.81 and 107.44 | Monthly Target 1 | 104.58 | | Monthly Target 2 | 105.41 | | Monthly Target 3 | 106.21333333333 | | Monthly Target 4 | 107.04 | | Monthly Target 5 | 107.84 |
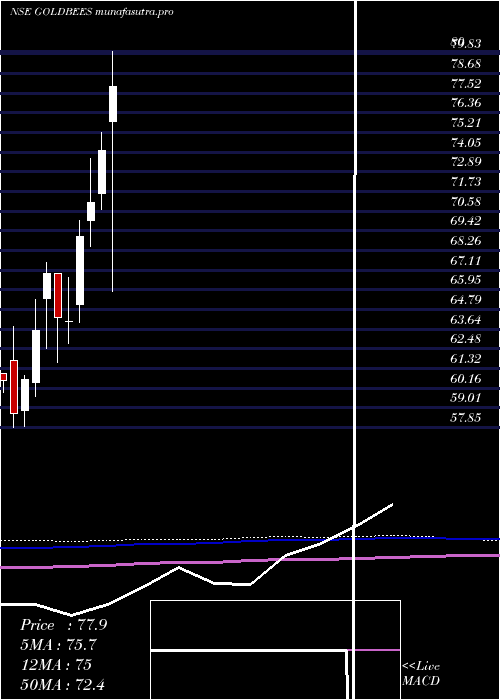
Monthly price and volumes Goldman Sachs
| Date |
Closing |
Open |
Range |
Volume |
Wed 10 December 2025 |
106.23 (1.54%) |
106.09 |
105.39 - 107.02 |
0.4511 times |
Fri 28 November 2025 |
104.62 (4.6%) |
100.02 |
99.03 - 105.46 |
1.0608 times |
Fri 31 October 2025 |
100.02 (4.35%) |
97.60 |
95.55 - 108.69 |
2.6502 times |
Tue 30 September 2025 |
95.85 (12.32%) |
86.76 |
84.44 - 97.74 |
1.3392 times |
Fri 29 August 2025 |
85.34 (3.82%) |
84.67 |
80.02 - 86.01 |
0.5385 times |
Thu 31 July 2025 |
82.20 (2.76%) |
80.95 |
79.00 - 84.78 |
0.564 times |
Mon 30 June 2025 |
79.99 (0.63%) |
80.90 |
79.42 - 85.00 |
0.7247 times |
Fri 30 May 2025 |
79.49 (0.51%) |
78.70 |
76.36 - 83.33 |
0.8921 times |
Wed 30 April 2025 |
79.09 (6.65%) |
75.84 |
65.85 - 83.56 |
1.1501 times |
Fri 28 March 2025 |
74.16 (4.3%) |
71.60 |
70.66 - 75.18 |
0.6293 times |
Fri 28 February 2025 |
71.10 (2.92%) |
70.00 |
68.47 - 73.70 |
0.802 times |
DMA SMA EMA moving averages of Goldman Sachs GOLDBEES
DMA (daily moving average) of Goldman Sachs GOLDBEES
| DMA period | DMA value | | 5 day DMA | 106.43 | | 12 day DMA | 105.62 | | 20 day DMA | 104.37 | | 35 day DMA | 102.84 | | 50 day DMA | 102.4 | | 100 day DMA | 94.28 | | 150 day DMA | 89.71 | | 200 day DMA | 86.14 | EMA (exponential moving average) of Goldman Sachs GOLDBEES
| EMA period | EMA current | EMA prev | EMA prev2 | | 5 day EMA | 106.29 | 106.32 | 106.34 | | 12 day EMA | 105.52 | 105.39 | 105.23 | | 20 day EMA | 104.6 | 104.43 | 104.24 | | 35 day EMA | 103.37 | 103.2 | 103.02 | | 50 day EMA | 102.16 | 101.99 | 101.81 |
SMA (simple moving average) of Goldman Sachs GOLDBEES
| SMA period | SMA current | SMA prev | SMA prev2 | | 5 day SMA | 106.43 | 106.49 | 106.36 | | 12 day SMA | 105.62 | 105.28 | 104.93 | | 20 day SMA | 104.37 | 104.2 | 104.05 | | 35 day SMA | 102.84 | 102.81 | 102.86 | | 50 day SMA | 102.4 | 102.16 | 101.93 | | 100 day SMA | 94.28 | 94.03 | 93.78 | | 150 day SMA | 89.71 | 89.55 | 89.38 | | 200 day SMA | 86.14 | 85.96 | 85.79 |
|
|
