GoenkaDiamond GOENKA_BZ full analysis,charts,indicators,moving averages,SMA,DMA,EMA,ADX,MACD,RSIGoenka Diamond GOENKA_BZ WideScreen charts, DMA,SMA,EMA technical analysis, forecast prediction, by indicators ADX,MACD,RSI,CCI NSE stock exchange
Daily price and charts and targets GoenkaDiamond Strong Daily Stock price targets for GoenkaDiamond GOENKA_BZ are 1.44 and 1.44 | Daily Target 1 | 1.44 | | Daily Target 2 | 1.44 | | Daily Target 3 | 1.44 | | Daily Target 4 | 1.44 | | Daily Target 5 | 1.44 |
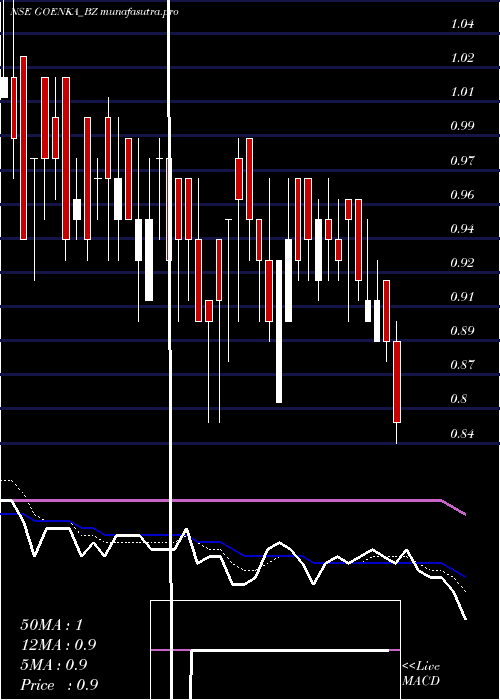
Daily price and volume Goenka Diamond
| Date |
Closing |
Open |
Range |
Volume |
Fri 24 October 2025 |
1.44 (4.35%) |
1.44 |
1.44 - 1.44 |
0.4435 times |
Thu 23 October 2025 |
1.38 (4.55%) |
1.38 |
1.38 - 1.38 |
0.6048 times |
Tue 21 October 2025 |
1.32 (4.76%) |
1.32 |
1.32 - 1.32 |
0.153 times |
Mon 20 October 2025 |
1.26 (5%) |
1.26 |
1.24 - 1.26 |
0.4359 times |
Fri 17 October 2025 |
1.20 (4.35%) |
1.19 |
1.12 - 1.20 |
0.8374 times |
Thu 16 October 2025 |
1.15 (3.6%) |
1.12 |
1.08 - 1.16 |
1.9671 times |
Wed 15 October 2025 |
1.11 (3.74%) |
1.07 |
1.04 - 1.12 |
1.0607 times |
Tue 14 October 2025 |
1.07 (-0.93%) |
1.06 |
1.04 - 1.13 |
0.9607 times |
Mon 13 October 2025 |
1.08 (1.89%) |
1.08 |
1.00 - 1.11 |
1.8183 times |
Fri 10 October 2025 |
1.06 (3.92%) |
1.02 |
1.00 - 1.07 |
1.7186 times |
Thu 09 October 2025 |
1.02 (-1.92%) |
1.00 |
1.00 - 1.09 |
1.3943 times |
Weekly price and charts GoenkaDiamond Strong weekly Stock price targets for GoenkaDiamond GOENKA_BZ are 1.34 and 1.54 | Weekly Target 1 | 1.17 | | Weekly Target 2 | 1.31 | | Weekly Target 3 | 1.3733333333333 | | Weekly Target 4 | 1.51 | | Weekly Target 5 | 1.57 |
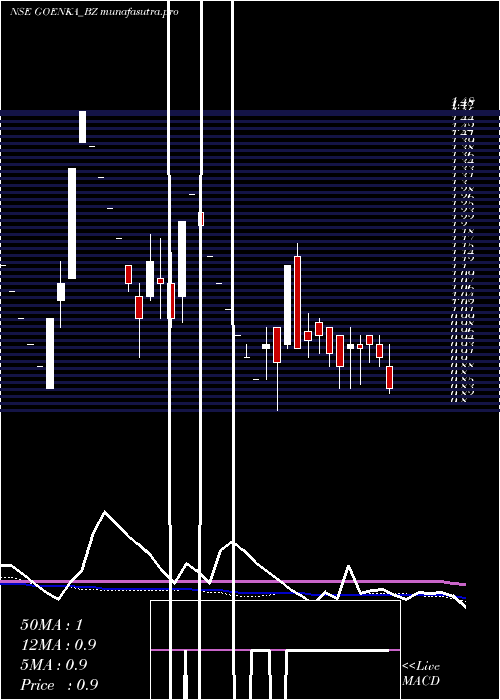
Weekly price and volumes for Goenka Diamond
| Date |
Closing |
Open |
Range |
Volume |
Fri 24 October 2025 |
1.44 (20%) |
1.26 |
1.24 - 1.44 |
0.5787 times |
Fri 17 October 2025 |
1.20 (13.21%) |
1.08 |
1.00 - 1.20 |
2.3484 times |
Fri 10 October 2025 |
1.06 (7.07%) |
1.03 |
0.95 - 1.09 |
2.1291 times |
Fri 03 October 2025 |
0.99 (4.21%) |
0.97 |
0.92 - 1.00 |
0.5454 times |
Fri 26 September 2025 |
0.95 (-12.04%) |
1.08 |
0.95 - 1.10 |
0.7784 times |
Fri 19 September 2025 |
1.08 (16.13%) |
0.92 |
0.91 - 1.10 |
1.133 times |
Fri 12 September 2025 |
0.93 (1.09%) |
0.96 |
0.89 - 0.97 |
0.5846 times |
Fri 05 September 2025 |
0.92 (-1.08%) |
0.91 |
0.90 - 1.00 |
0.7224 times |
Fri 29 August 2025 |
0.93 (1.09%) |
0.89 |
0.88 - 0.96 |
0.6049 times |
Fri 22 August 2025 |
0.92 (9.52%) |
0.84 |
0.82 - 0.97 |
0.5751 times |
Thu 14 August 2025 |
0.84 (0%) |
0.88 |
0.80 - 0.88 |
0.262 times |
Monthly price and charts GoenkaDiamond Strong monthly Stock price targets for GoenkaDiamond GOENKA_BZ are 1.2 and 1.69 | Monthly Target 1 | 0.79 | | Monthly Target 2 | 1.11 | | Monthly Target 3 | 1.2766666666667 | | Monthly Target 4 | 1.6 | | Monthly Target 5 | 1.77 |
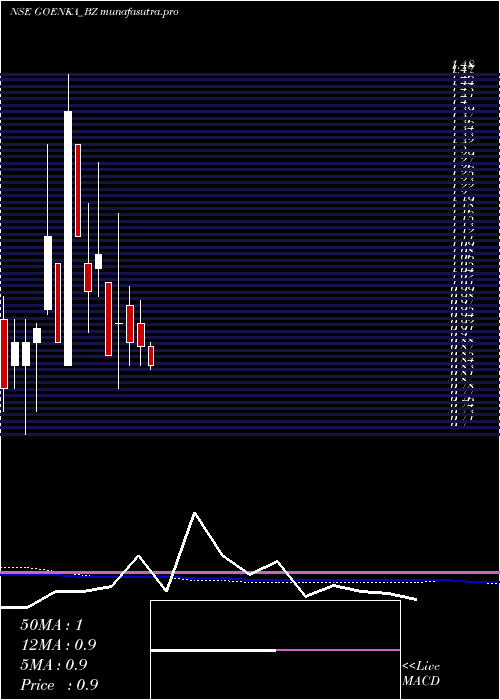
Monthly price and volumes Goenka Diamond
| Date |
Closing |
Open |
Range |
Volume |
Fri 24 October 2025 |
1.44 (51.58%) |
0.98 |
0.95 - 1.44 |
1.7128 times |
Tue 30 September 2025 |
0.95 (2.15%) |
0.91 |
0.89 - 1.10 |
1.0858 times |
Fri 29 August 2025 |
0.93 (12.05%) |
0.84 |
0.80 - 0.97 |
0.6759 times |
Thu 31 July 2025 |
0.83 (-8.79%) |
0.94 |
0.80 - 0.95 |
0.8432 times |
Mon 30 June 2025 |
0.91 (5.81%) |
0.90 |
0.82 - 1.02 |
1.265 times |
Fri 30 May 2025 |
0.86 (-3.37%) |
0.89 |
0.76 - 0.95 |
0.6705 times |
Wed 30 April 2025 |
0.89 (-1.11%) |
0.94 |
0.85 - 0.99 |
0.7644 times |
Fri 28 March 2025 |
0.90 (-4.26%) |
0.98 |
0.85 - 1.02 |
1.3389 times |
Fri 28 February 2025 |
0.94 (8.05%) |
0.94 |
0.80 - 1.18 |
1.4978 times |
Mon 27 January 2025 |
0.87 (-20.18%) |
1.03 |
0.87 - 1.03 |
0.1456 times |
Mon 30 December 2024 |
1.09 (7.92%) |
1.06 |
1.00 - 1.29 |
0.3996 times |
DMA SMA EMA moving averages of Goenka Diamond GOENKA_BZ
DMA (daily moving average) of Goenka Diamond GOENKA_BZ
| DMA period | DMA value | | 5 day DMA | 1.32 | | 12 day DMA | 1.18 | | 20 day DMA | 1.1 | | 35 day DMA | 1.04 | | 50 day DMA | 1 | | 100 day DMA | 0.95 | | 150 day DMA | 0.93 | | 200 day DMA | 0.95 | EMA (exponential moving average) of Goenka Diamond GOENKA_BZ
| EMA period | EMA current | EMA prev | EMA prev2 | | 5 day EMA | 1.33 | 1.27 | 1.22 | | 12 day EMA | 1.21 | 1.17 | 1.13 | | 20 day EMA | 1.14 | 1.11 | 1.08 | | 35 day EMA | 1.07 | 1.05 | 1.03 | | 50 day EMA | 1.02 | 1 | 0.98 |
SMA (simple moving average) of Goenka Diamond GOENKA_BZ
| SMA period | SMA current | SMA prev | SMA prev2 | | 5 day SMA | 1.32 | 1.26 | 1.21 | | 12 day SMA | 1.18 | 1.14 | 1.11 | | 20 day SMA | 1.1 | 1.07 | 1.05 | | 35 day SMA | 1.04 | 1.03 | 1.01 | | 50 day SMA | 1 | 0.99 | 0.97 | | 100 day SMA | 0.95 | 0.94 | 0.94 | | 150 day SMA | 0.93 | 0.93 | 0.93 | | 200 day SMA | 0.95 | 0.95 | 0.95 |
|
|
