GodrejIndustries GODREJIND full analysis,charts,indicators,moving averages,SMA,DMA,EMA,ADX,MACD,RSIGodrej Industries GODREJIND WideScreen charts, DMA,SMA,EMA technical analysis, forecast prediction, by indicators ADX,MACD,RSI,CCI NSE stock exchange
operates under Commodity Chemicals sector
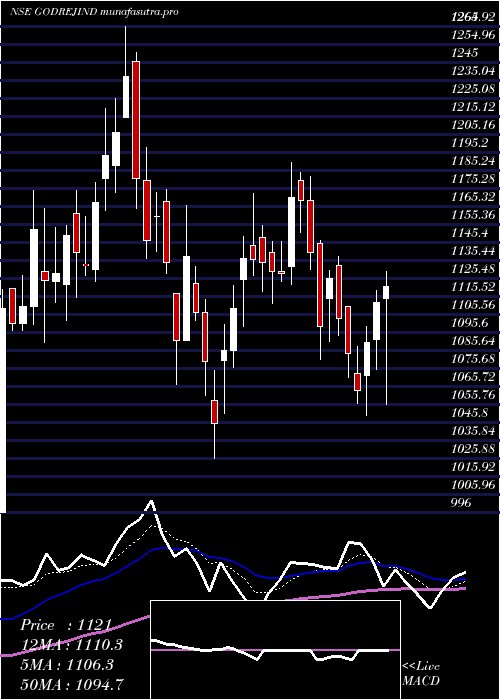
Daily price and charts and targets GodrejIndustries Strong Daily Stock price targets for GodrejIndustries GODREJIND are 1062.75 and 1094.65 | Daily Target 1 | 1053.7 | | Daily Target 2 | 1071.8 | | Daily Target 3 | 1085.6 | | Daily Target 4 | 1103.7 | | Daily Target 5 | 1117.5 |
Daily price and volume Godrej Industries
| Date |
Closing |
Open |
Range |
Volume |
Tue 28 October 2025 |
1089.90 (-0.45%) |
1094.80 |
1067.50 - 1099.40 |
2.1723 times |
Mon 27 October 2025 |
1094.80 (0.75%) |
1087.90 |
1077.00 - 1100.50 |
0.6428 times |
Fri 24 October 2025 |
1086.70 (-0.79%) |
1100.00 |
1071.20 - 1100.00 |
0.8288 times |
Thu 23 October 2025 |
1095.30 (-1.01%) |
1106.50 |
1085.90 - 1109.50 |
0.6454 times |
Tue 21 October 2025 |
1106.50 (0.54%) |
1085.00 |
1085.00 - 1116.00 |
0.1815 times |
Mon 20 October 2025 |
1100.60 (1.73%) |
1081.90 |
1077.00 - 1104.30 |
0.9561 times |
Fri 17 October 2025 |
1081.90 (-0.06%) |
1089.00 |
1055.00 - 1089.50 |
1.0638 times |
Thu 16 October 2025 |
1082.50 (1.11%) |
1078.00 |
1063.50 - 1095.90 |
0.9071 times |
Wed 15 October 2025 |
1070.60 (0.72%) |
1065.00 |
1050.10 - 1077.50 |
0.9128 times |
Tue 14 October 2025 |
1062.90 (1.37%) |
1054.50 |
1032.50 - 1071.10 |
1.6893 times |
Mon 13 October 2025 |
1048.50 (-2.82%) |
1070.00 |
1045.00 - 1073.40 |
0.5567 times |
Weekly price and charts GodrejIndustries Strong weekly Stock price targets for GodrejIndustries GODREJIND are 1078.7 and 1111.7 | Weekly Target 1 | 1052.97 | | Weekly Target 2 | 1071.43 | | Weekly Target 3 | 1085.9666666667 | | Weekly Target 4 | 1104.43 | | Weekly Target 5 | 1118.97 |
Weekly price and volumes for Godrej Industries
| Date |
Closing |
Open |
Range |
Volume |
Tue 28 October 2025 |
1089.90 (0.29%) |
1087.90 |
1067.50 - 1100.50 |
0.6265 times |
Fri 24 October 2025 |
1086.70 (0.44%) |
1081.90 |
1071.20 - 1116.00 |
0.5812 times |
Fri 17 October 2025 |
1081.90 (0.28%) |
1070.00 |
1032.50 - 1095.90 |
1.1416 times |
Fri 10 October 2025 |
1078.90 (-7.1%) |
1162.90 |
1055.30 - 1163.10 |
0.9348 times |
Fri 03 October 2025 |
1161.30 (-2.82%) |
1192.00 |
1157.00 - 1216.10 |
0.5875 times |
Fri 26 September 2025 |
1195.00 (1.65%) |
1182.60 |
1170.00 - 1242.00 |
1.6723 times |
Fri 19 September 2025 |
1175.60 (-2.9%) |
1210.70 |
1160.00 - 1269.80 |
2.8778 times |
Fri 12 September 2025 |
1210.70 (0.73%) |
1210.00 |
1190.70 - 1225.00 |
0.3298 times |
Fri 05 September 2025 |
1201.90 (-2.3%) |
1229.00 |
1182.50 - 1231.40 |
0.7432 times |
Fri 29 August 2025 |
1230.20 (-4.46%) |
1287.60 |
1225.00 - 1295.00 |
0.5052 times |
Fri 22 August 2025 |
1287.60 (8.99%) |
1196.30 |
1193.00 - 1325.00 |
2.6855 times |
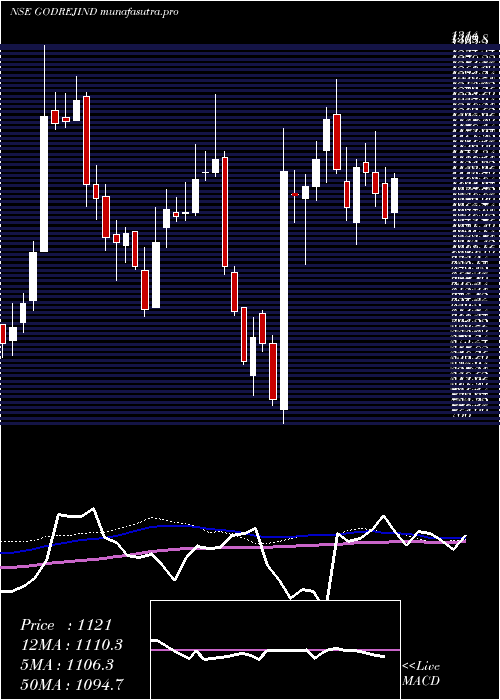
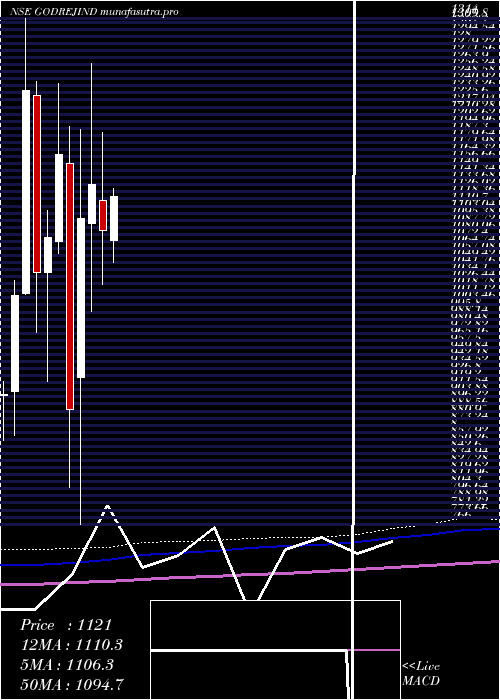
Monthly price and charts GodrejIndustries Strong monthly Stock price targets for GodrejIndustries GODREJIND are 969.4 and 1153 | Monthly Target 1 | 929.23 | | Monthly Target 2 | 1009.57 | | Monthly Target 3 | 1112.8333333333 | | Monthly Target 4 | 1193.17 | | Monthly Target 5 | 1296.43 |
Monthly price and volumes Godrej Industries
| Date |
Closing |
Open |
Range |
Volume |
Tue 28 October 2025 |
1089.90 (-9.3%) |
1195.00 |
1032.50 - 1216.10 |
0.2846 times |
Tue 30 September 2025 |
1201.70 (-2.32%) |
1229.00 |
1160.00 - 1269.80 |
0.4504 times |
Fri 29 August 2025 |
1230.20 (7.22%) |
1147.40 |
1078.30 - 1325.00 |
0.5031 times |
Thu 31 July 2025 |
1147.40 (-7.93%) |
1248.00 |
1082.00 - 1259.20 |
0.553 times |
Mon 30 June 2025 |
1246.20 (5.19%) |
1186.00 |
1171.90 - 1390.00 |
1.2386 times |
Fri 30 May 2025 |
1184.70 (9.3%) |
1072.90 |
1049.60 - 1212.20 |
0.731 times |
Wed 30 April 2025 |
1083.90 (-4.43%) |
1117.00 |
1026.00 - 1190.00 |
0.3127 times |
Fri 28 March 2025 |
1134.15 (3.33%) |
1092.30 |
996.00 - 1265.00 |
1.2018 times |
Fri 28 February 2025 |
1097.60 (23.25%) |
925.00 |
766.00 - 1194.00 |
4.4761 times |
Fri 31 January 2025 |
890.55 (-23.64%) |
1156.20 |
805.75 - 1196.90 |
0.2487 times |
Tue 31 December 2024 |
1166.20 (8.37%) |
1072.75 |
1059.65 - 1243.40 |
0.4354 times |
DMA SMA EMA moving averages of Godrej Industries GODREJIND
DMA (daily moving average) of Godrej Industries GODREJIND
| DMA period | DMA value | | 5 day DMA | 1094.64 | | 12 day DMA | 1083.26 | | 20 day DMA | 1105.8 | | 35 day DMA | 1148.46 | | 50 day DMA | 1177.19 | | 100 day DMA | 1184.63 | | 150 day DMA | 1169.97 | | 200 day DMA | 1121.6 | EMA (exponential moving average) of Godrej Industries GODREJIND
| EMA period | EMA current | EMA prev | EMA prev2 | | 5 day EMA | 1091.56 | 1092.39 | 1091.19 | | 12 day EMA | 1095.71 | 1096.77 | 1097.13 | | 20 day EMA | 1109.48 | 1111.54 | 1113.3 | | 35 day EMA | 1133.56 | 1136.13 | 1138.56 | | 50 day EMA | 1163.82 | 1166.84 | 1169.78 |
SMA (simple moving average) of Godrej Industries GODREJIND
| SMA period | SMA current | SMA prev | SMA prev2 | | 5 day SMA | 1094.64 | 1096.78 | 1094.2 | | 12 day SMA | 1083.26 | 1081.27 | 1079.36 | | 20 day SMA | 1105.8 | 1111.06 | 1116.94 | | 35 day SMA | 1148.46 | 1151.66 | 1154.57 | | 50 day SMA | 1177.19 | 1178.9 | 1178.91 | | 100 day SMA | 1184.63 | 1185.62 | 1186.59 | | 150 day SMA | 1169.97 | 1170.49 | 1170.74 | | 200 day SMA | 1121.6 | 1121.64 | 1121.91 |
|
|
