GodhaCabcon GODHA_BE full analysis,charts,indicators,moving averages,SMA,DMA,EMA,ADX,MACD,RSIGodha Cabcon GODHA_BE WideScreen charts, DMA,SMA,EMA technical analysis, forecast prediction, by indicators ADX,MACD,RSI,CCI NSE stock exchange
Daily price and charts and targets GodhaCabcon Strong Daily Stock price targets for GodhaCabcon GODHA_BE are 0.57 and 0.6 | Daily Target 1 | 0.56 | | Daily Target 2 | 0.58 | | Daily Target 3 | 0.59333333333333 | | Daily Target 4 | 0.61 | | Daily Target 5 | 0.62 |
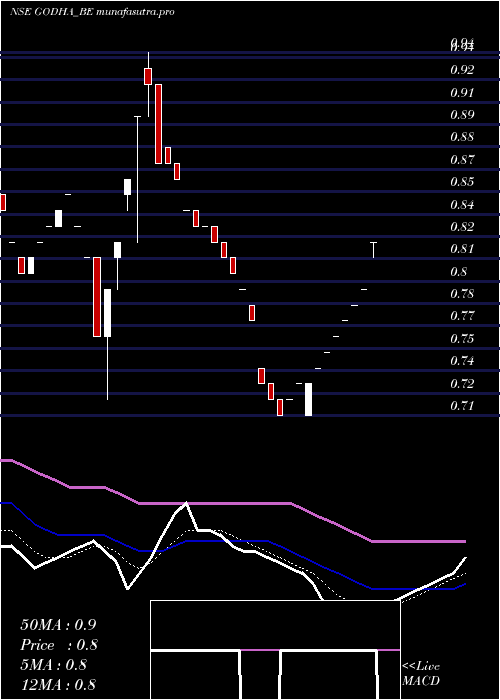
Daily price and volume Godha Cabcon
| Date |
Closing |
Open |
Range |
Volume |
Wed 03 September 2025 |
0.59 (-1.67%) |
0.60 |
0.58 - 0.61 |
0.8051 times |
Tue 02 September 2025 |
0.60 (1.69%) |
0.60 |
0.58 - 0.61 |
1.559 times |
Mon 01 September 2025 |
0.59 (3.51%) |
0.58 |
0.57 - 0.59 |
1.0125 times |
Fri 29 August 2025 |
0.57 (0%) |
0.56 |
0.56 - 0.58 |
0.8012 times |
Thu 28 August 2025 |
0.57 (-1.72%) |
0.57 |
0.56 - 0.58 |
0.856 times |
Tue 26 August 2025 |
0.58 (-1.69%) |
0.59 |
0.58 - 0.60 |
0.8909 times |
Mon 25 August 2025 |
0.59 (0%) |
0.59 |
0.58 - 0.60 |
1.0341 times |
Fri 22 August 2025 |
0.59 (-1.67%) |
0.60 |
0.59 - 0.61 |
0.7851 times |
Thu 21 August 2025 |
0.60 (-1.64%) |
0.62 |
0.60 - 0.62 |
0.904 times |
Wed 20 August 2025 |
0.61 (1.67%) |
0.61 |
0.59 - 0.62 |
1.3521 times |
Tue 19 August 2025 |
0.60 (-1.64%) |
0.61 |
0.60 - 0.61 |
0.8552 times |
Weekly price and charts GodhaCabcon Strong weekly Stock price targets for GodhaCabcon GODHA_BE are 0.58 and 0.62 | Weekly Target 1 | 0.55 | | Weekly Target 2 | 0.57 | | Weekly Target 3 | 0.59 | | Weekly Target 4 | 0.61 | | Weekly Target 5 | 0.63 |
Weekly price and volumes for Godha Cabcon
| Date |
Closing |
Open |
Range |
Volume |
Wed 03 September 2025 |
0.59 (3.51%) |
0.58 |
0.57 - 0.61 |
0.6576 times |
Fri 29 August 2025 |
0.57 (-3.39%) |
0.59 |
0.56 - 0.60 |
0.6977 times |
Fri 22 August 2025 |
0.59 (0%) |
0.60 |
0.59 - 0.62 |
1.0441 times |
Thu 14 August 2025 |
0.59 (0%) |
0.59 |
0.56 - 0.60 |
0.7285 times |
Fri 08 August 2025 |
0.59 (-1.67%) |
0.61 |
0.58 - 0.62 |
0.813 times |
Fri 01 August 2025 |
0.60 (0%) |
0.60 |
0.58 - 0.62 |
0.7607 times |
Fri 25 July 2025 |
0.60 (-9.09%) |
0.67 |
0.60 - 0.68 |
1.5221 times |
Fri 18 July 2025 |
0.66 (0%) |
0.62 |
0.58 - 0.70 |
2.3883 times |
Fri 11 July 2025 |
0.66 (-13.16%) |
0.72 |
0.66 - 0.72 |
0.619 times |
Fri 02 May 2025 |
0.76 (-7.32%) |
0.82 |
0.76 - 0.85 |
0.769 times |
Fri 25 April 2025 |
0.82 (3.8%) |
0.82 |
0.80 - 0.87 |
0.4371 times |

Monthly price and charts GodhaCabcon Strong monthly Stock price targets for GodhaCabcon GODHA_BE are 0.58 and 0.62 | Monthly Target 1 | 0.55 | | Monthly Target 2 | 0.57 | | Monthly Target 3 | 0.59 | | Monthly Target 4 | 0.61 | | Monthly Target 5 | 0.63 |
Monthly price and volumes Godha Cabcon
| Date |
Closing |
Open |
Range |
Volume |
Wed 03 September 2025 |
0.59 (3.51%) |
0.58 |
0.57 - 0.61 |
0.2183 times |
Fri 29 August 2025 |
0.57 (-6.56%) |
0.61 |
0.56 - 0.62 |
1.1426 times |
Thu 31 July 2025 |
0.61 (-19.74%) |
0.72 |
0.58 - 0.72 |
1.7037 times |
Fri 02 May 2025 |
0.76 (-6.17%) |
0.81 |
0.76 - 0.85 |
0.1633 times |
Wed 30 April 2025 |
0.81 (10.96%) |
0.73 |
0.71 - 0.87 |
0.3927 times |
Fri 28 March 2025 |
0.73 (-9.88%) |
0.81 |
0.72 - 0.94 |
0.5272 times |
Fri 28 February 2025 |
0.81 (-19%) |
0.99 |
0.80 - 0.99 |
0.3507 times |
Fri 31 January 2025 |
1.00 (-20%) |
1.20 |
0.96 - 1.36 |
1.7371 times |
Tue 31 December 2024 |
1.25 (31.58%) |
0.96 |
0.93 - 1.41 |
2.8843 times |
Fri 29 November 2024 |
0.95 (9.2%) |
0.88 |
0.88 - 1.03 |
0.88 times |
Fri 11 October 2024 |
0.87 (1.16%) |
0.86 |
0.82 - 0.91 |
0.5681 times |

DMA SMA EMA moving averages of Godha Cabcon GODHA_BE
DMA (daily moving average) of Godha Cabcon GODHA_BE
| DMA period | DMA value | | 5 day DMA | 0.58 | | 12 day DMA | 0.59 | | 20 day DMA | 0.59 | | 35 day DMA | 0.61 | | 50 day DMA | 0.66 | | 100 day DMA | 0.76 | | 150 day DMA | 0.87 | | 200 day DMA | 0.88 | EMA (exponential moving average) of Godha Cabcon GODHA_BE
| EMA period | EMA current | EMA prev | EMA prev2 | | 5 day EMA | 0.59 | 0.59 | 0.58 | | 12 day EMA | 0.6 | 0.6 | 0.6 | | 20 day EMA | 0.62 | 0.62 | 0.62 | | 35 day EMA | 0.65 | 0.65 | 0.65 | | 50 day EMA | 0.67 | 0.67 | 0.67 |
SMA (simple moving average) of Godha Cabcon GODHA_BE
| SMA period | SMA current | SMA prev | SMA prev2 | | 5 day SMA | 0.58 | 0.58 | 0.58 | | 12 day SMA | 0.59 | 0.59 | 0.59 | | 20 day SMA | 0.59 | 0.59 | 0.59 | | 35 day SMA | 0.61 | 0.61 | 0.61 | | 50 day SMA | 0.66 | 0.66 | 0.66 | | 100 day SMA | 0.76 | 0.76 | 0.77 | | 150 day SMA | 0.87 | 0.87 | 0.88 | | 200 day SMA | 0.88 | 0.88 | 0.88 |
|
|
