GodavariBiorefineries GODAVARIB full analysis,charts,indicators,moving averages,SMA,DMA,EMA,ADX,MACD,RSIGodavari Biorefineries GODAVARIB WideScreen charts, DMA,SMA,EMA technical analysis, forecast prediction, by indicators ADX,MACD,RSI,CCI NSE stock exchange
Daily price and charts and targets GodavariBiorefineries Strong Daily Stock price targets for GodavariBiorefineries GODAVARIB are 273.95 and 284.4 | Daily Target 1 | 266.33 | | Daily Target 2 | 271.12 | | Daily Target 3 | 276.78333333333 | | Daily Target 4 | 281.57 | | Daily Target 5 | 287.23 |
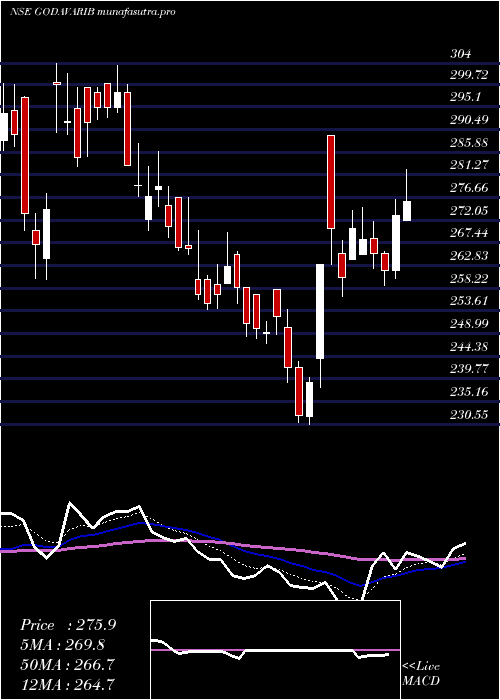
Daily price and volume Godavari Biorefineries
| Date |
Closing |
Open |
Range |
Volume |
Wed 29 October 2025 |
275.90 (1.03%) |
272.00 |
272.00 - 282.45 |
1.6393 times |
Tue 28 October 2025 |
273.10 (4.32%) |
261.80 |
260.30 - 276.20 |
3.0623 times |
Mon 27 October 2025 |
261.80 (-1.32%) |
265.30 |
258.75 - 265.65 |
1.0283 times |
Fri 24 October 2025 |
265.30 (-1.06%) |
268.40 |
262.15 - 271.75 |
0.3785 times |
Thu 23 October 2025 |
268.15 (-0.81%) |
265.05 |
265.05 - 274.70 |
0.4955 times |
Tue 21 October 2025 |
270.35 (3.84%) |
264.05 |
264.05 - 274.00 |
0.1265 times |
Mon 20 October 2025 |
260.35 (-3.7%) |
265.25 |
256.50 - 268.00 |
0.6124 times |
Fri 17 October 2025 |
270.35 (2.79%) |
289.30 |
263.00 - 289.30 |
1.8678 times |
Thu 16 October 2025 |
263.00 (10%) |
243.90 |
238.10 - 263.00 |
0.6147 times |
Wed 15 October 2025 |
239.10 (2.95%) |
232.20 |
230.55 - 240.10 |
0.1747 times |
Tue 14 October 2025 |
232.25 (-4.05%) |
242.05 |
231.00 - 243.30 |
0.5209 times |
Weekly price and charts GodavariBiorefineries Strong weekly Stock price targets for GodavariBiorefineries GODAVARIB are 267.33 and 291.03 | Weekly Target 1 | 248.67 | | Weekly Target 2 | 262.28 | | Weekly Target 3 | 272.36666666667 | | Weekly Target 4 | 285.98 | | Weekly Target 5 | 296.07 |
Weekly price and volumes for Godavari Biorefineries
| Date |
Closing |
Open |
Range |
Volume |
Wed 29 October 2025 |
275.90 (4%) |
265.30 |
258.75 - 282.45 |
3.2203 times |
Fri 24 October 2025 |
265.30 (-1.87%) |
265.25 |
256.50 - 274.70 |
0.9065 times |
Fri 17 October 2025 |
270.35 (7.11%) |
250.20 |
230.55 - 289.30 |
1.9465 times |
Fri 10 October 2025 |
252.40 (-3.87%) |
265.00 |
247.05 - 265.65 |
0.4292 times |
Fri 03 October 2025 |
262.55 (-1.39%) |
260.00 |
253.98 - 269.91 |
0.2463 times |
Fri 26 September 2025 |
266.25 (-4.62%) |
272.25 |
265.06 - 285.99 |
0.4259 times |
Fri 19 September 2025 |
279.14 (-4.42%) |
298.00 |
277.00 - 303.57 |
0.4321 times |
Fri 12 September 2025 |
292.06 (9.37%) |
264.30 |
260.10 - 304.00 |
0.5437 times |
Fri 13 June 2025 |
267.05 (-6.35%) |
287.85 |
260.30 - 299.95 |
0.9185 times |
Fri 06 June 2025 |
285.15 (-0.01%) |
284.95 |
270.00 - 298.80 |
0.9311 times |
Fri 30 May 2025 |
285.17 (56.47%) |
198.00 |
198.00 - 302.59 |
4.4476 times |

Monthly price and charts GodavariBiorefineries Strong monthly Stock price targets for GodavariBiorefineries GODAVARIB are 253.23 and 311.98 | Monthly Target 1 | 206.5 | | Monthly Target 2 | 241.2 | | Monthly Target 3 | 265.25 | | Monthly Target 4 | 299.95 | | Monthly Target 5 | 324 |
Monthly price and volumes Godavari Biorefineries
| Date |
Closing |
Open |
Range |
Volume |
Wed 29 October 2025 |
275.90 (8.15%) |
259.00 |
230.55 - 289.30 |
0.8665 times |
Tue 30 September 2025 |
255.12 (-6.99%) |
300.00 |
253.98 - 304.00 |
0.1829 times |
Mon 16 June 2025 |
274.30 (-3.81%) |
284.95 |
260.10 - 299.95 |
0.2557 times |
Fri 30 May 2025 |
285.17 (56.47%) |
198.00 |
198.00 - 302.59 |
0.5804 times |
Tue 18 February 2025 |
182.25 (-25.85%) |
240.01 |
176.02 - 252.13 |
0.3061 times |
Fri 31 January 2025 |
245.80 (-21.94%) |
313.05 |
217.00 - 320.85 |
0.7409 times |
Tue 31 December 2024 |
314.90 (-10.97%) |
353.00 |
305.25 - 408.60 |
1.8684 times |
Fri 29 November 2024 |
353.70 (0.51%) |
355.00 |
274.10 - 373.00 |
2.1374 times |
Thu 31 October 2024 |
351.90 (0%) |
308.00 |
308.00 - 360.00 |
2.0616 times |
Wed 29 October 2025 |
(0%) |
|
- |
0 times |

DMA SMA EMA moving averages of Godavari Biorefineries GODAVARIB
DMA (daily moving average) of Godavari Biorefineries GODAVARIB
| DMA period | DMA value | | 5 day DMA | 268.85 | | 12 day DMA | 260.14 | | 20 day DMA | 257.86 | | 35 day DMA | 268.37 | | 50 day DMA | 271.26 | | 100 day DMA | 274.67 | | 150 day DMA | | | 200 day DMA | | EMA (exponential moving average) of Godavari Biorefineries GODAVARIB
| EMA period | EMA current | EMA prev | EMA prev2 | | 5 day EMA | 269.78 | 266.72 | 263.53 | | 12 day EMA | 264.69 | 262.65 | 260.75 | | 20 day EMA | 263.3 | 261.97 | 260.8 | | 35 day EMA | 262.66 | 261.88 | 261.22 | | 50 day EMA | 264.99 | 264.54 | 264.19 |
SMA (simple moving average) of Godavari Biorefineries GODAVARIB
| SMA period | SMA current | SMA prev | SMA prev2 | | 5 day SMA | 268.85 | 267.74 | 265.19 | | 12 day SMA | 260.14 | 258.18 | 256.2 | | 20 day SMA | 257.86 | 256.92 | 256.58 | | 35 day SMA | 268.37 | 268.33 | 268.15 | | 50 day SMA | 271.26 | 270.32 | 268.5 | | 100 day SMA | 274.67 | 275.76 | 276.96 | | 150 day SMA | | 200 day SMA |
|
|
