GoFashion GOCOLORS full analysis,charts,indicators,moving averages,SMA,DMA,EMA,ADX,MACD,RSIGo Fashion GOCOLORS WideScreen charts, DMA,SMA,EMA technical analysis, forecast prediction, by indicators ADX,MACD,RSI,CCI NSE stock exchange
Daily price and charts and targets GoFashion Strong Daily Stock price targets for GoFashion GOCOLORS are 640.4 and 662 | Daily Target 1 | 636.4 | | Daily Target 2 | 644.4 | | Daily Target 3 | 658 | | Daily Target 4 | 666 | | Daily Target 5 | 679.6 |
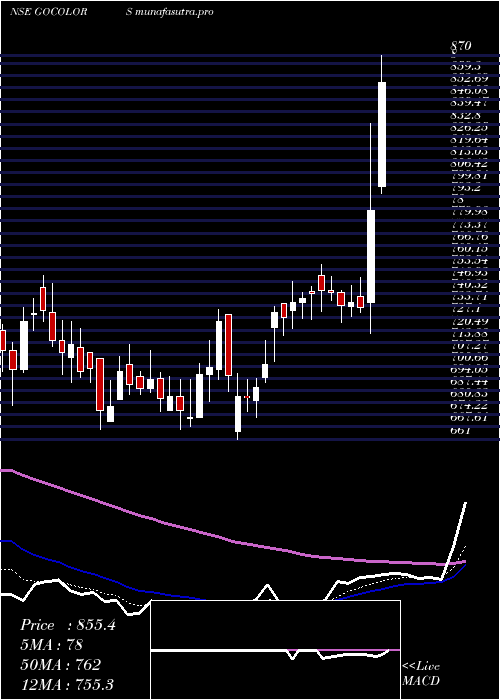
Daily price and volume Go Fashion
| Date |
Closing |
Open |
Range |
Volume |
Tue 28 October 2025 |
652.40 (-2.34%) |
669.95 |
650.00 - 671.60 |
0.6378 times |
Mon 27 October 2025 |
668.05 (-2.05%) |
690.35 |
666.25 - 690.35 |
0.365 times |
Fri 24 October 2025 |
682.00 (-0.18%) |
685.25 |
676.60 - 689.95 |
0.5638 times |
Thu 23 October 2025 |
683.25 (0.25%) |
682.00 |
678.05 - 691.00 |
0.6284 times |
Tue 21 October 2025 |
681.55 (0.61%) |
684.20 |
671.00 - 688.35 |
0.0749 times |
Mon 20 October 2025 |
677.40 (2%) |
664.15 |
660.00 - 684.20 |
1.3528 times |
Fri 17 October 2025 |
664.15 (-1.45%) |
677.30 |
660.00 - 689.60 |
0.8584 times |
Thu 16 October 2025 |
673.95 (-0.91%) |
681.00 |
665.00 - 685.30 |
2.9229 times |
Wed 15 October 2025 |
680.15 (0.73%) |
675.00 |
675.00 - 698.00 |
0.6347 times |
Tue 14 October 2025 |
675.20 (-0.41%) |
677.95 |
666.60 - 681.50 |
1.9612 times |
Mon 13 October 2025 |
677.95 (0.33%) |
671.00 |
670.00 - 684.00 |
1.424 times |
Weekly price and charts GoFashion Strong weekly Stock price targets for GoFashion GOCOLORS are 631.03 and 671.38 | Weekly Target 1 | 623.9 | | Weekly Target 2 | 638.15 | | Weekly Target 3 | 664.25 | | Weekly Target 4 | 678.5 | | Weekly Target 5 | 704.6 |
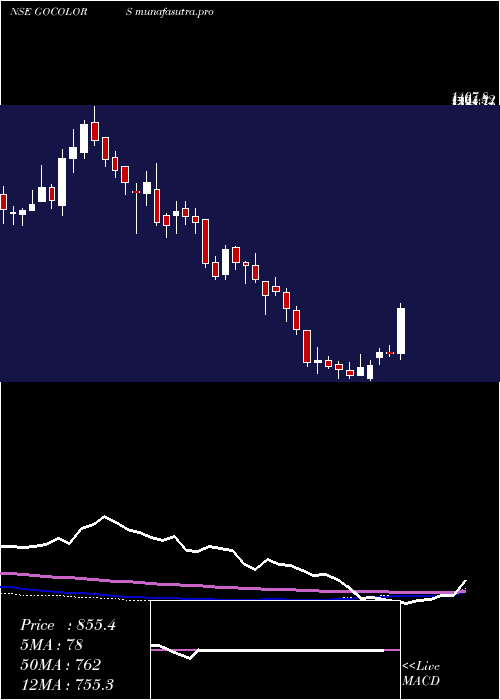
Weekly price and volumes for Go Fashion
| Date |
Closing |
Open |
Range |
Volume |
Tue 28 October 2025 |
652.40 (-4.34%) |
690.35 |
650.00 - 690.35 |
0.3764 times |
Fri 24 October 2025 |
682.00 (2.69%) |
664.15 |
660.00 - 691.00 |
0.9833 times |
Fri 17 October 2025 |
664.15 (-1.72%) |
671.00 |
660.00 - 698.00 |
2.9279 times |
Fri 10 October 2025 |
675.75 (-3.9%) |
706.00 |
672.25 - 715.45 |
0.6365 times |
Fri 03 October 2025 |
703.15 (2.32%) |
687.20 |
670.10 - 708.00 |
0.7246 times |
Fri 26 September 2025 |
687.20 (-7.05%) |
743.20 |
680.20 - 743.20 |
0.6954 times |
Fri 19 September 2025 |
739.30 (3.95%) |
711.20 |
696.60 - 744.00 |
0.6361 times |
Fri 12 September 2025 |
711.20 (-2.62%) |
734.10 |
705.55 - 760.90 |
1.4046 times |
Fri 05 September 2025 |
730.30 (3.55%) |
705.25 |
696.70 - 747.50 |
0.8283 times |
Fri 29 August 2025 |
705.25 (1.61%) |
701.05 |
689.15 - 718.00 |
0.787 times |
Fri 22 August 2025 |
694.10 (1.03%) |
700.90 |
685.20 - 709.25 |
0.5062 times |
Monthly price and charts GoFashion Strong monthly Stock price targets for GoFashion GOCOLORS are 618.48 and 683.93 | Monthly Target 1 | 607.17 | | Monthly Target 2 | 629.78 | | Monthly Target 3 | 672.61666666667 | | Monthly Target 4 | 695.23 | | Monthly Target 5 | 738.07 |
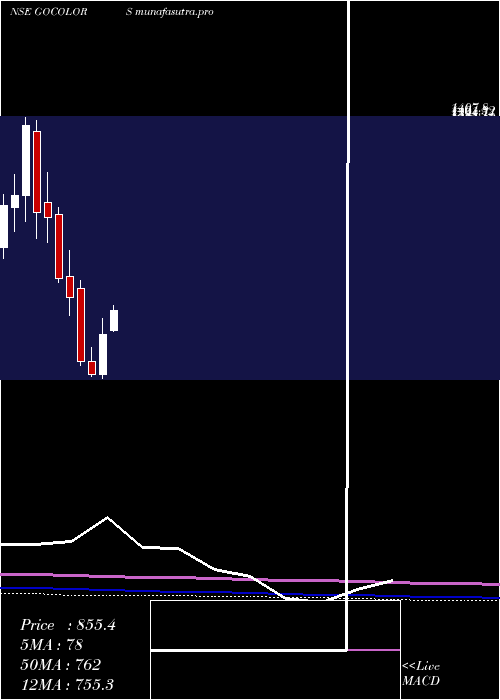
Monthly price and volumes Go Fashion
| Date |
Closing |
Open |
Range |
Volume |
Tue 28 October 2025 |
652.40 (-3.23%) |
674.15 |
650.00 - 715.45 |
0.8166 times |
Tue 30 September 2025 |
674.15 (-4.41%) |
705.25 |
670.10 - 760.90 |
0.6378 times |
Fri 29 August 2025 |
705.25 (-14.36%) |
827.90 |
681.30 - 843.90 |
1.1436 times |
Thu 31 July 2025 |
823.55 (-6.92%) |
865.00 |
812.55 - 919.90 |
0.8153 times |
Mon 30 June 2025 |
884.80 (3.96%) |
841.70 |
825.50 - 905.00 |
0.8089 times |
Fri 30 May 2025 |
851.10 (8.3%) |
799.00 |
795.00 - 943.75 |
2.1404 times |
Wed 30 April 2025 |
785.90 (16.79%) |
672.90 |
661.00 - 833.40 |
1.4699 times |
Fri 28 March 2025 |
672.90 (-5.16%) |
709.50 |
666.00 - 750.00 |
0.9731 times |
Fri 28 February 2025 |
709.50 (-20.53%) |
917.95 |
698.15 - 941.95 |
0.6118 times |
Fri 31 January 2025 |
892.75 (-5.71%) |
951.80 |
840.40 - 1028.15 |
0.5827 times |
Tue 31 December 2024 |
946.85 (-15.61%) |
1129.90 |
936.00 - 1150.10 |
0.316 times |
DMA SMA EMA moving averages of Go Fashion GOCOLORS
DMA (daily moving average) of Go Fashion GOCOLORS
| DMA period | DMA value | | 5 day DMA | 673.45 | | 12 day DMA | 674.32 | | 20 day DMA | 678.31 | | 35 day DMA | 696.87 | | 50 day DMA | 699.18 | | 100 day DMA | 771.87 | | 150 day DMA | 777.03 | | 200 day DMA | 794.6 | EMA (exponential moving average) of Go Fashion GOCOLORS
| EMA period | EMA current | EMA prev | EMA prev2 | | 5 day EMA | 668.13 | 675.99 | 679.96 | | 12 day EMA | 674.71 | 678.77 | 680.72 | | 20 day EMA | 680.4 | 683.35 | 684.96 | | 35 day EMA | 687.58 | 689.65 | 690.92 | | 50 day EMA | 696.56 | 698.36 | 699.6 |
SMA (simple moving average) of Go Fashion GOCOLORS
| SMA period | SMA current | SMA prev | SMA prev2 | | 5 day SMA | 673.45 | 678.45 | 677.67 | | 12 day SMA | 674.32 | 676.38 | 677.23 | | 20 day SMA | 678.31 | 680.05 | 681.35 | | 35 day SMA | 696.87 | 699.1 | 700.99 | | 50 day SMA | 699.18 | 699.93 | 700.5 | | 100 day SMA | 771.87 | 774.03 | 776.22 | | 150 day SMA | 777.03 | 777.33 | 777.4 | | 200 day SMA | 794.6 | 796.25 | 797.99 |
|
|
