GoclCorporation GOCLCORP full analysis,charts,indicators,moving averages,SMA,DMA,EMA,ADX,MACD,RSIGocl Corporation GOCLCORP WideScreen charts, DMA,SMA,EMA technical analysis, forecast prediction, by indicators ADX,MACD,RSI,CCI NSE stock exchange
operates under Oil Marketing & Distribution sector
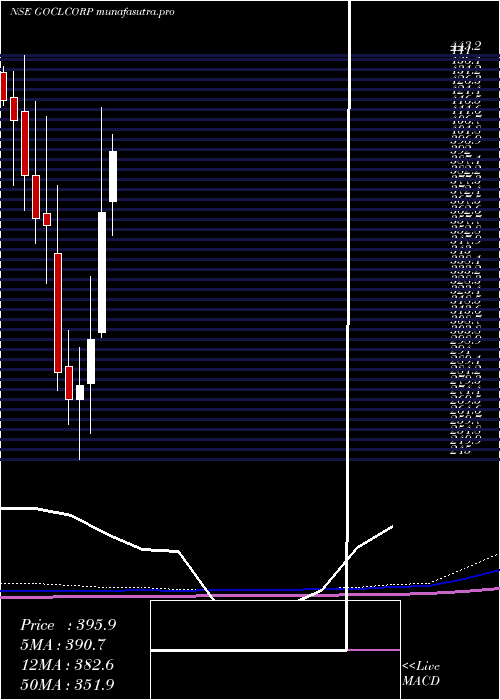
Daily price and charts and targets GoclCorporation Strong Daily Stock price targets for GoclCorporation GOCLCORP are 365.7 and 376.65 | Daily Target 1 | 358.17 | | Daily Target 2 | 362.28 | | Daily Target 3 | 369.11666666667 | | Daily Target 4 | 373.23 | | Daily Target 5 | 380.07 |
Daily price and volume Gocl Corporation
| Date |
Closing |
Open |
Range |
Volume |
Tue 28 October 2025 |
366.40 (-0.16%) |
365.00 |
365.00 - 375.95 |
1.7151 times |
Mon 27 October 2025 |
367.00 (4.23%) |
350.00 |
348.05 - 370.00 |
2.187 times |
Fri 24 October 2025 |
352.10 (0.92%) |
349.00 |
345.00 - 354.60 |
0.9338 times |
Thu 23 October 2025 |
348.90 (-1.59%) |
355.25 |
347.15 - 358.00 |
0.5082 times |
Tue 21 October 2025 |
354.55 (1.65%) |
348.80 |
348.80 - 356.45 |
0.2282 times |
Mon 20 October 2025 |
348.80 (-1.01%) |
356.00 |
347.00 - 357.75 |
0.6441 times |
Fri 17 October 2025 |
352.35 (-2.17%) |
357.50 |
349.10 - 362.45 |
0.657 times |
Thu 16 October 2025 |
360.15 (-0.37%) |
363.50 |
356.50 - 365.45 |
0.6676 times |
Wed 15 October 2025 |
361.50 (2.93%) |
350.15 |
350.15 - 363.00 |
1.9245 times |
Tue 14 October 2025 |
351.20 (-0.31%) |
352.30 |
349.50 - 358.00 |
0.5344 times |
Mon 13 October 2025 |
352.30 (0.31%) |
351.20 |
348.00 - 353.30 |
0.4744 times |
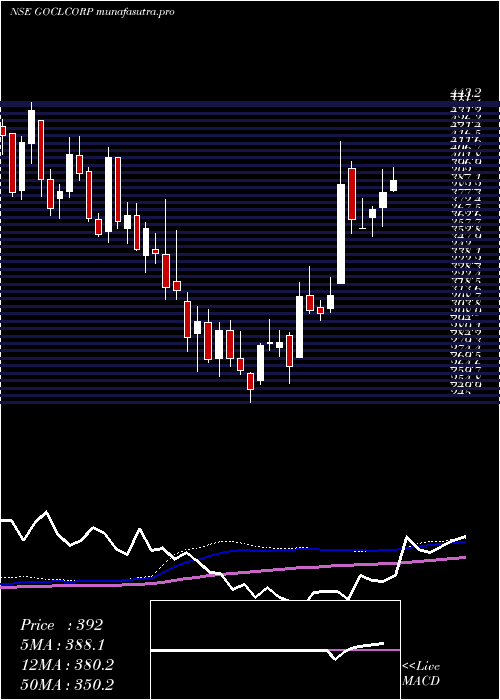
Weekly price and charts GoclCorporation Strong weekly Stock price targets for GoclCorporation GOCLCORP are 357.23 and 385.13 | Weekly Target 1 | 335.57 | | Weekly Target 2 | 350.98 | | Weekly Target 3 | 363.46666666667 | | Weekly Target 4 | 378.88 | | Weekly Target 5 | 391.37 |
Weekly price and volumes for Gocl Corporation
| Date |
Closing |
Open |
Range |
Volume |
Tue 28 October 2025 |
366.40 (4.06%) |
350.00 |
348.05 - 375.95 |
0.4497 times |
Fri 24 October 2025 |
352.10 (-0.07%) |
356.00 |
345.00 - 358.00 |
0.2667 times |
Fri 17 October 2025 |
352.35 (0.33%) |
351.20 |
348.00 - 365.45 |
0.4907 times |
Fri 10 October 2025 |
351.20 (-2.76%) |
364.00 |
345.00 - 364.80 |
0.4642 times |
Fri 03 October 2025 |
361.15 (2.73%) |
352.95 |
345.20 - 366.90 |
0.392 times |
Fri 26 September 2025 |
351.55 (-3.76%) |
364.05 |
349.00 - 372.35 |
0.5197 times |
Fri 19 September 2025 |
365.30 (3.73%) |
354.00 |
341.60 - 377.80 |
1.8447 times |
Fri 12 September 2025 |
352.15 (-2.06%) |
363.00 |
349.50 - 374.90 |
0.9326 times |
Fri 05 September 2025 |
359.55 (1.15%) |
373.00 |
345.60 - 389.85 |
3.6972 times |
Fri 29 August 2025 |
355.45 (-10.52%) |
401.70 |
352.90 - 401.70 |
0.9426 times |
Fri 22 August 2025 |
397.25 (11.24%) |
366.00 |
354.55 - 401.25 |
3.0293 times |
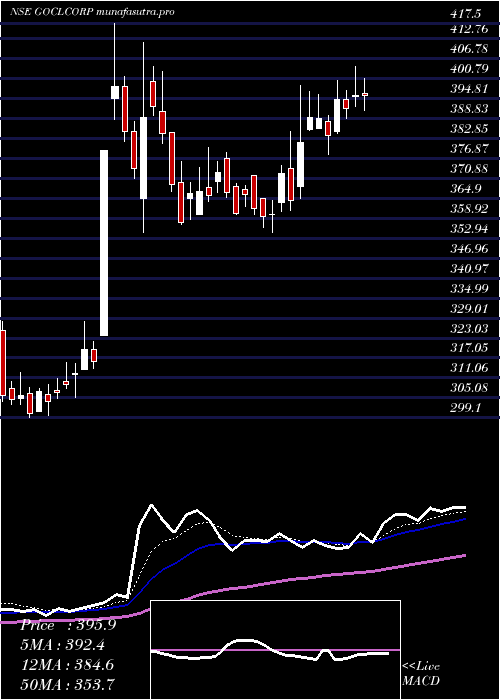
Monthly price and charts GoclCorporation Strong monthly Stock price targets for GoclCorporation GOCLCORP are 355.7 and 386.65 | Monthly Target 1 | 331.5 | | Monthly Target 2 | 348.95 | | Monthly Target 3 | 362.45 | | Monthly Target 4 | 379.9 | | Monthly Target 5 | 393.4 |
Monthly price and volumes Gocl Corporation
| Date |
Closing |
Open |
Range |
Volume |
Tue 28 October 2025 |
366.40 (5.23%) |
351.00 |
345.00 - 375.95 |
0.3292 times |
Tue 30 September 2025 |
348.20 (-2.04%) |
373.00 |
341.60 - 389.85 |
1.2707 times |
Fri 29 August 2025 |
355.45 (-0.42%) |
360.50 |
333.90 - 401.70 |
1.0044 times |
Thu 31 July 2025 |
356.95 (-2.51%) |
371.70 |
354.40 - 407.70 |
0.9643 times |
Mon 30 June 2025 |
366.15 (20.4%) |
307.40 |
304.80 - 417.50 |
2.9375 times |
Fri 30 May 2025 |
304.10 (7.97%) |
282.35 |
257.85 - 335.00 |
0.7183 times |
Wed 30 April 2025 |
281.65 (2.64%) |
274.40 |
245.00 - 300.15 |
0.4539 times |
Fri 28 March 2025 |
274.40 (-4.74%) |
291.00 |
262.30 - 308.45 |
1.0498 times |
Fri 28 February 2025 |
288.05 (-19.95%) |
346.00 |
279.00 - 379.50 |
0.9402 times |
Fri 31 January 2025 |
359.85 (-0.94%) |
365.70 |
331.20 - 413.25 |
0.3318 times |
Tue 31 December 2024 |
363.25 (-5.5%) |
384.40 |
350.80 - 420.60 |
0.3352 times |
DMA SMA EMA moving averages of Gocl Corporation GOCLCORP
DMA (daily moving average) of Gocl Corporation GOCLCORP
| DMA period | DMA value | | 5 day DMA | 357.79 | | 12 day DMA | 355.54 | | 20 day DMA | 355.09 | | 35 day DMA | 357.28 | | 50 day DMA | 359.96 | | 100 day DMA | 365.04 | | 150 day DMA | 339.29 | | 200 day DMA | 336.44 | EMA (exponential moving average) of Gocl Corporation GOCLCORP
| EMA period | EMA current | EMA prev | EMA prev2 | | 5 day EMA | 360.17 | 357.05 | 352.07 | | 12 day EMA | 357.09 | 355.4 | 353.29 | | 20 day EMA | 356.68 | 355.66 | 354.47 | | 35 day EMA | 357.29 | 356.75 | 356.15 | | 50 day EMA | 358.76 | 358.45 | 358.1 |
SMA (simple moving average) of Gocl Corporation GOCLCORP
| SMA period | SMA current | SMA prev | SMA prev2 | | 5 day SMA | 357.79 | 354.27 | 351.34 | | 12 day SMA | 355.54 | 354.42 | 352.86 | | 20 day SMA | 355.09 | 354.35 | 353.87 | | 35 day SMA | 357.28 | 357.08 | 356.91 | | 50 day SMA | 359.96 | 360.01 | 359.62 | | 100 day SMA | 365.04 | 364.5 | 363.92 | | 150 day SMA | 339.29 | 338.77 | 338.13 | | 200 day SMA | 336.44 | 336.56 | 336.76 |
|
|
