GnaAxles GNA full analysis,charts,indicators,moving averages,SMA,DMA,EMA,ADX,MACD,RSIGna Axles GNA WideScreen charts, DMA,SMA,EMA technical analysis, forecast prediction, by indicators ADX,MACD,RSI,CCI NSE stock exchange
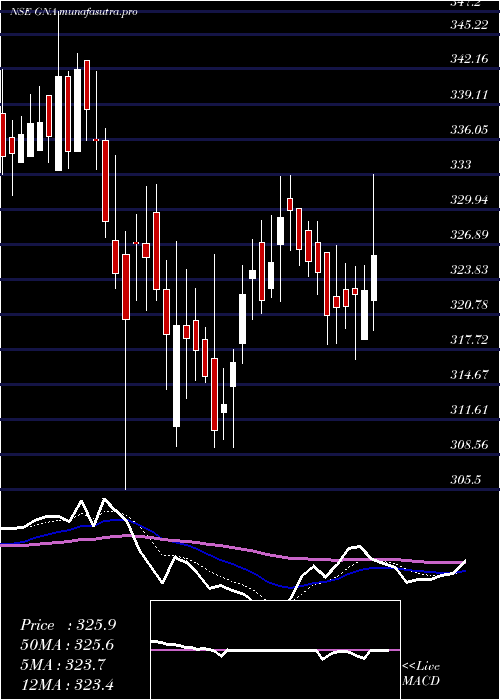
Daily price and charts and targets GnaAxles Strong Daily Stock price targets for GnaAxles GNA are 315.68 and 328.68 | Daily Target 1 | 305.13 | | Daily Target 2 | 313.22 | | Daily Target 3 | 318.13333333333 | | Daily Target 4 | 326.22 | | Daily Target 5 | 331.13 |
Daily price and volume Gna Axles
| Date |
Closing |
Open |
Range |
Volume |
Wed 29 October 2025 |
321.30 (3.51%) |
312.00 |
310.05 - 323.05 |
1.5578 times |
Tue 28 October 2025 |
310.40 (-0.66%) |
312.45 |
309.00 - 315.60 |
1.0815 times |
Mon 27 October 2025 |
312.45 (-1.15%) |
317.80 |
309.90 - 317.80 |
0.7165 times |
Fri 24 October 2025 |
316.10 (0.32%) |
316.00 |
312.55 - 318.35 |
1.0751 times |
Thu 23 October 2025 |
315.10 (1.61%) |
311.70 |
311.70 - 318.95 |
1.8647 times |
Tue 21 October 2025 |
310.10 (1.01%) |
307.00 |
305.05 - 310.85 |
0.6991 times |
Mon 20 October 2025 |
307.00 (0.21%) |
308.00 |
304.00 - 309.70 |
0.8231 times |
Fri 17 October 2025 |
306.35 (-0.33%) |
308.95 |
303.70 - 309.65 |
0.6544 times |
Thu 16 October 2025 |
307.35 (0.7%) |
308.00 |
305.25 - 310.80 |
0.8843 times |
Wed 15 October 2025 |
305.20 (0.98%) |
305.00 |
301.35 - 306.55 |
0.6435 times |
Tue 14 October 2025 |
302.25 (-2.23%) |
310.00 |
301.60 - 311.45 |
1.509 times |
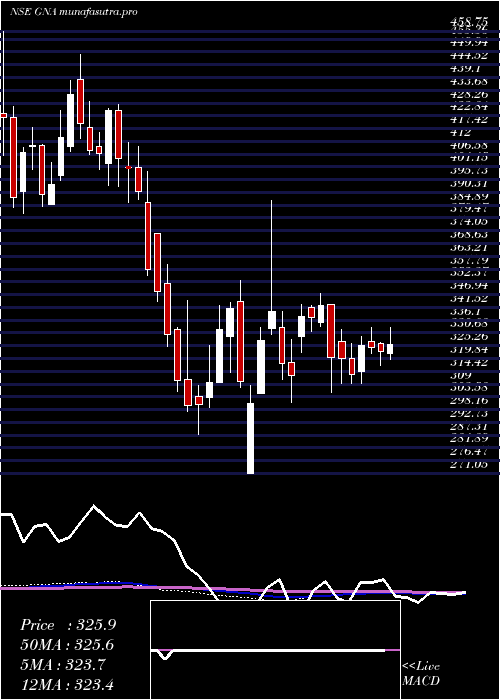
Weekly price and charts GnaAxles Strong weekly Stock price targets for GnaAxles GNA are 315.15 and 329.2 | Weekly Target 1 | 303.73 | | Weekly Target 2 | 312.52 | | Weekly Target 3 | 317.78333333333 | | Weekly Target 4 | 326.57 | | Weekly Target 5 | 331.83 |
Weekly price and volumes for Gna Axles
| Date |
Closing |
Open |
Range |
Volume |
Wed 29 October 2025 |
321.30 (1.65%) |
317.80 |
309.00 - 323.05 |
0.4449 times |
Fri 24 October 2025 |
316.10 (3.18%) |
308.00 |
304.00 - 318.95 |
0.5916 times |
Fri 17 October 2025 |
306.35 (-2.27%) |
309.50 |
301.35 - 312.80 |
0.5922 times |
Fri 10 October 2025 |
313.45 (0.06%) |
314.50 |
307.95 - 314.90 |
0.5262 times |
Fri 03 October 2025 |
313.25 (1%) |
311.00 |
305.55 - 314.80 |
0.353 times |
Fri 26 September 2025 |
310.15 (-2.08%) |
319.00 |
308.00 - 332.90 |
1.7236 times |
Fri 19 September 2025 |
316.75 (1.95%) |
312.00 |
309.45 - 325.00 |
1.4749 times |
Fri 12 September 2025 |
310.70 (0.88%) |
309.55 |
303.90 - 318.55 |
1.0641 times |
Fri 05 September 2025 |
308.00 (2.8%) |
300.00 |
293.80 - 324.55 |
1.9907 times |
Fri 29 August 2025 |
299.60 (-4.77%) |
314.60 |
291.80 - 315.95 |
1.2388 times |
Fri 22 August 2025 |
314.60 (5.54%) |
299.60 |
299.60 - 336.00 |
3.2761 times |
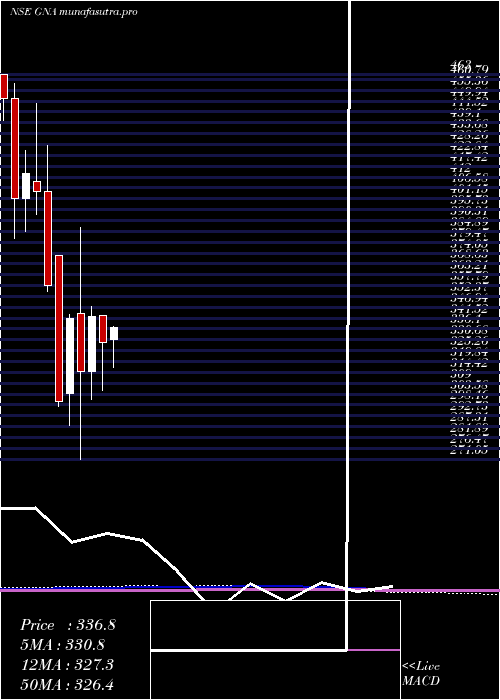
Monthly price and charts GnaAxles Strong monthly Stock price targets for GnaAxles GNA are 311.33 and 333.03 | Monthly Target 1 | 293.53 | | Monthly Target 2 | 307.42 | | Monthly Target 3 | 315.23333333333 | | Monthly Target 4 | 329.12 | | Monthly Target 5 | 336.93 |
Monthly price and volumes Gna Axles
| Date |
Closing |
Open |
Range |
Volume |
Wed 29 October 2025 |
321.30 (4.15%) |
311.40 |
301.35 - 323.05 |
0.2112 times |
Tue 30 September 2025 |
308.50 (2.97%) |
300.00 |
293.80 - 332.90 |
0.581 times |
Fri 29 August 2025 |
299.60 (-1.82%) |
305.15 |
291.80 - 336.00 |
0.558 times |
Thu 31 July 2025 |
305.15 (-7.31%) |
330.85 |
299.55 - 342.30 |
0.8236 times |
Mon 30 June 2025 |
329.20 (-3.78%) |
342.95 |
305.50 - 342.95 |
0.9727 times |
Fri 30 May 2025 |
342.15 (8.74%) |
314.65 |
301.00 - 347.20 |
0.5906 times |
Wed 30 April 2025 |
314.65 (-7.75%) |
343.80 |
271.05 - 386.95 |
2.9457 times |
Fri 28 March 2025 |
341.10 (13.78%) |
303.80 |
287.75 - 343.45 |
1.4074 times |
Fri 28 February 2025 |
299.80 (-16.18%) |
372.90 |
297.30 - 372.90 |
1.1448 times |
Fri 31 January 2025 |
357.65 (-11.6%) |
404.60 |
355.00 - 427.70 |
0.765 times |
Tue 31 December 2024 |
404.60 (-2.22%) |
410.00 |
393.05 - 448.80 |
0.4952 times |
DMA SMA EMA moving averages of Gna Axles GNA
DMA (daily moving average) of Gna Axles GNA
| DMA period | DMA value | | 5 day DMA | 315.07 | | 12 day DMA | 310.23 | | 20 day DMA | 310.66 | | 35 day DMA | 312.57 | | 50 day DMA | 311.84 | | 100 day DMA | 315.19 | | 150 day DMA | 319.55 | | 200 day DMA | 326.35 | EMA (exponential moving average) of Gna Axles GNA
| EMA period | EMA current | EMA prev | EMA prev2 | | 5 day EMA | 314.89 | 311.69 | 312.34 | | 12 day EMA | 312.52 | 310.92 | 311.01 | | 20 day EMA | 311.91 | 310.92 | 310.97 | | 35 day EMA | 311.04 | 310.44 | 310.44 | | 50 day EMA | 311.24 | 310.83 | 310.85 |
SMA (simple moving average) of Gna Axles GNA
| SMA period | SMA current | SMA prev | SMA prev2 | | 5 day SMA | 315.07 | 312.83 | 312.15 | | 12 day SMA | 310.23 | 309.58 | 309.78 | | 20 day SMA | 310.66 | 310.02 | 310.01 | | 35 day SMA | 312.57 | 312.36 | 312.3 | | 50 day SMA | 311.84 | 311.37 | 311.2 | | 100 day SMA | 315.19 | 315.22 | 315.41 | | 150 day SMA | 319.55 | 319.62 | 319.8 | | 200 day SMA | 326.35 | 326.8 | 327.26 |
|
|
