GlobalVectra GLOBALVECT full analysis,charts,indicators,moving averages,SMA,DMA,EMA,ADX,MACD,RSIGlobal Vectra GLOBALVECT WideScreen charts, DMA,SMA,EMA technical analysis, forecast prediction, by indicators ADX,MACD,RSI,CCI NSE stock exchange
operates under Airlines sector
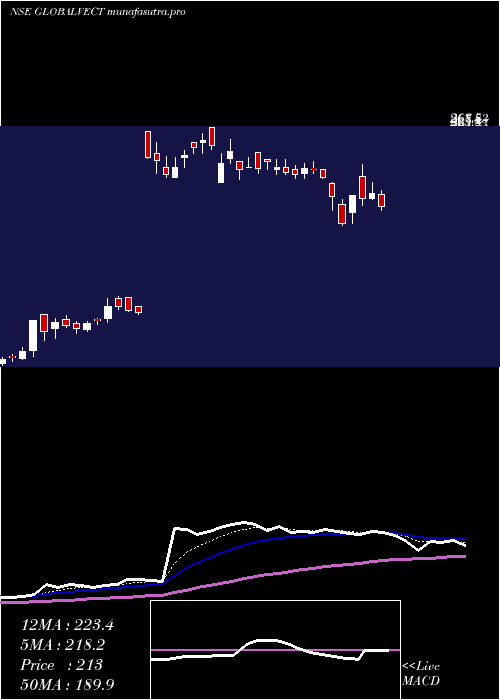
Daily price and charts and targets GlobalVectra Strong Daily Stock price targets for GlobalVectra GLOBALVECT are 218.24 and 224.73 | Daily Target 1 | 216.99 | | Daily Target 2 | 219.48 | | Daily Target 3 | 223.48333333333 | | Daily Target 4 | 225.97 | | Daily Target 5 | 229.97 |
Daily price and volume Global Vectra
| Date |
Closing |
Open |
Range |
Volume |
Wed 29 October 2025 |
221.96 (-0.8%) |
223.00 |
221.00 - 227.49 |
0.131 times |
Tue 28 October 2025 |
223.76 (-0%) |
225.05 |
223.00 - 228.53 |
0.1005 times |
Mon 27 October 2025 |
223.77 (-1.87%) |
234.00 |
216.31 - 234.00 |
0.2467 times |
Fri 24 October 2025 |
228.04 (-0.51%) |
231.92 |
226.00 - 234.50 |
0.1541 times |
Thu 23 October 2025 |
229.20 (-1.74%) |
233.27 |
227.66 - 237.59 |
0.4254 times |
Tue 21 October 2025 |
233.27 (0.45%) |
236.58 |
231.00 - 236.58 |
0.1045 times |
Mon 20 October 2025 |
232.23 (1.99%) |
227.69 |
227.69 - 239.84 |
1.1475 times |
Fri 17 October 2025 |
227.69 (-6.35%) |
248.00 |
225.21 - 248.00 |
1.5245 times |
Thu 16 October 2025 |
243.14 (20%) |
206.00 |
205.00 - 243.14 |
5.9643 times |
Wed 15 October 2025 |
202.62 (3.25%) |
199.00 |
195.42 - 205.50 |
0.2016 times |
Tue 14 October 2025 |
196.25 (4.16%) |
191.99 |
190.20 - 205.40 |
0.6532 times |
Weekly price and charts GlobalVectra Strong weekly Stock price targets for GlobalVectra GLOBALVECT are 210.29 and 227.98 | Weekly Target 1 | 206.4 | | Weekly Target 2 | 214.18 | | Weekly Target 3 | 224.09 | | Weekly Target 4 | 231.87 | | Weekly Target 5 | 241.78 |
Weekly price and volumes for Global Vectra
| Date |
Closing |
Open |
Range |
Volume |
Wed 29 October 2025 |
221.96 (-2.67%) |
234.00 |
216.31 - 234.00 |
0.3245 times |
Fri 24 October 2025 |
228.04 (0.15%) |
227.69 |
226.00 - 239.84 |
1.243 times |
Fri 17 October 2025 |
227.69 (21.34%) |
185.00 |
185.00 - 248.00 |
5.7189 times |
Fri 10 October 2025 |
187.65 (-9.71%) |
205.55 |
181.31 - 208.24 |
0.5088 times |
Fri 03 October 2025 |
207.84 (0.64%) |
212.00 |
204.00 - 212.00 |
0.2271 times |
Fri 26 September 2025 |
206.51 (-5.89%) |
215.50 |
203.00 - 221.00 |
0.4224 times |
Fri 19 September 2025 |
219.43 (2.9%) |
212.10 |
212.10 - 226.12 |
0.4211 times |
Fri 12 September 2025 |
213.24 (1.91%) |
212.40 |
207.01 - 227.25 |
0.5621 times |
Fri 05 September 2025 |
209.25 (-0.09%) |
212.90 |
207.04 - 221.28 |
0.3047 times |
Fri 29 August 2025 |
209.44 (-1.17%) |
214.80 |
205.95 - 216.28 |
0.2674 times |
Fri 22 August 2025 |
211.93 (1.82%) |
218.00 |
209.92 - 218.00 |
0.2265 times |
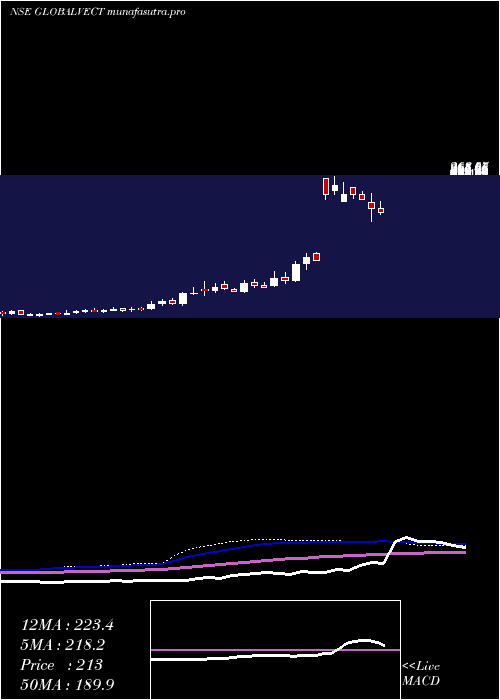
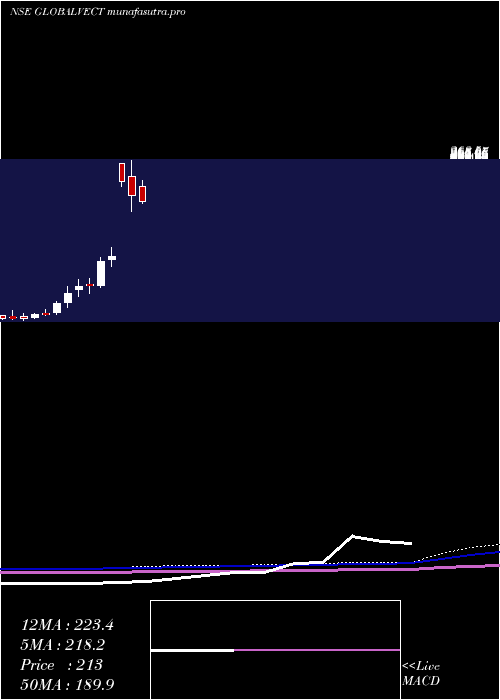
Monthly price and charts GlobalVectra Strong monthly Stock price targets for GlobalVectra GLOBALVECT are 201.64 and 268.33 | Monthly Target 1 | 150.4 | | Monthly Target 2 | 186.18 | | Monthly Target 3 | 217.09 | | Monthly Target 4 | 252.87 | | Monthly Target 5 | 283.78 |
Monthly price and volumes Global Vectra
| Date |
Closing |
Open |
Range |
Volume |
Wed 29 October 2025 |
221.96 (7.07%) |
208.90 |
181.31 - 248.00 |
1.3495 times |
Tue 30 September 2025 |
207.30 (-1.02%) |
212.90 |
203.00 - 227.25 |
0.3128 times |
Fri 29 August 2025 |
209.44 (-6.86%) |
224.86 |
205.55 - 239.70 |
0.2388 times |
Thu 31 July 2025 |
224.86 (-7.63%) |
243.43 |
207.90 - 278.40 |
1.0299 times |
Mon 30 June 2025 |
243.43 (1.37%) |
240.14 |
205.00 - 280.50 |
1.0572 times |
Fri 30 May 2025 |
240.14 (8.71%) |
233.99 |
198.11 - 266.00 |
0.3562 times |
Wed 30 April 2025 |
220.90 (-8.03%) |
247.00 |
199.27 - 268.50 |
0.3876 times |
Fri 28 March 2025 |
240.20 (73.93%) |
265.69 |
233.06 - 265.70 |
0.0388 times |
Wed 10 January 2024 |
138.10 (5.3%) |
133.15 |
123.70 - 149.95 |
0.9208 times |
Fri 29 December 2023 |
131.15 (33.55%) |
98.00 |
95.20 - 136.80 |
4.3085 times |
Thu 30 November 2023 |
98.20 (1.81%) |
99.00 |
87.00 - 107.80 |
1.7597 times |
DMA SMA EMA moving averages of Global Vectra GLOBALVECT
DMA (daily moving average) of Global Vectra GLOBALVECT
| DMA period | DMA value | | 5 day DMA | 225.35 | | 12 day DMA | 220.86 | | 20 day DMA | 212.29 | | 35 day DMA | 212.53 | | 50 day DMA | 212.34 | | 100 day DMA | 224.82 | | 150 day DMA | 225.75 | | 200 day DMA | 195.73 | EMA (exponential moving average) of Global Vectra GLOBALVECT
| EMA period | EMA current | EMA prev | EMA prev2 | | 5 day EMA | 224.22 | 225.35 | 226.15 | | 12 day EMA | 220.85 | 220.65 | 220.08 | | 20 day EMA | 217.49 | 217.02 | 216.31 | | 35 day EMA | 215.12 | 214.72 | 214.19 | | 50 day EMA | 214.33 | 214.02 | 213.62 |
SMA (simple moving average) of Global Vectra GLOBALVECT
| SMA period | SMA current | SMA prev | SMA prev2 | | 5 day SMA | 225.35 | 227.61 | 229.3 | | 12 day SMA | 220.86 | 218 | 214.58 | | 20 day SMA | 212.29 | 211.48 | 210.62 | | 35 day SMA | 212.53 | 212.33 | 211.92 | | 50 day SMA | 212.34 | 212.06 | 212.11 | | 100 day SMA | 224.82 | 225 | 225.09 | | 150 day SMA | 225.75 | 225.22 | 224.68 | | 200 day SMA | 195.73 | 195.05 | 194.39 |
|
|
