Gkw GKWLIMITED full analysis,charts,indicators,moving averages,SMA,DMA,EMA,ADX,MACD,RSIGkw GKWLIMITED WideScreen charts, DMA,SMA,EMA technical analysis, forecast prediction, by indicators ADX,MACD,RSI,CCI NSE stock exchange
Daily price and charts and targets Gkw Strong Daily Stock price targets for Gkw GKWLIMITED are 1787.65 and 1980.45 | Daily Target 1 | 1644.9 | | Daily Target 2 | 1737.6 | | Daily Target 3 | 1837.7 | | Daily Target 4 | 1930.4 | | Daily Target 5 | 2030.5 |
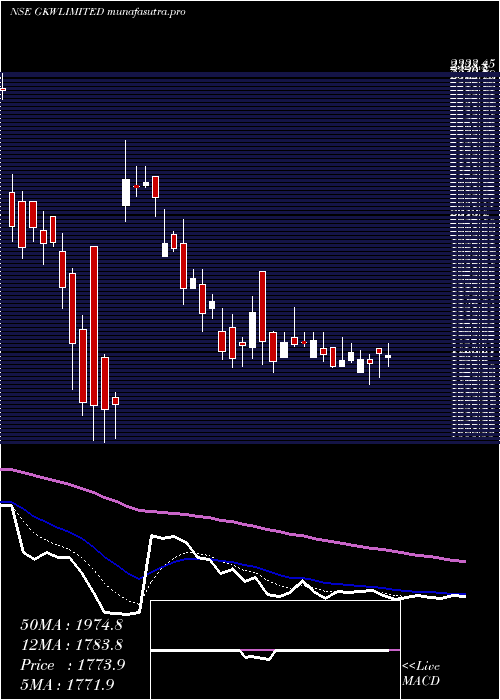
Daily price and volume Gkw
| Date |
Closing |
Open |
Range |
Volume |
Wed 29 October 2025 |
1830.30 (6.5%) |
1745.00 |
1745.00 - 1937.80 |
4.6845 times |
Tue 28 October 2025 |
1718.60 (-1.82%) |
1750.50 |
1712.00 - 1750.50 |
0.3006 times |
Mon 27 October 2025 |
1750.50 (0.03%) |
1799.00 |
1750.00 - 1806.10 |
0.3006 times |
Fri 24 October 2025 |
1749.90 (-1.12%) |
1770.00 |
1731.50 - 1819.90 |
1.0507 times |
Thu 23 October 2025 |
1769.70 (0.7%) |
1799.90 |
1705.00 - 1799.90 |
0.3537 times |
Tue 21 October 2025 |
1757.40 (0.57%) |
1755.10 |
1750.00 - 1782.90 |
0.0803 times |
Mon 20 October 2025 |
1747.50 (2.28%) |
1721.50 |
1712.90 - 1768.30 |
0.0998 times |
Fri 17 October 2025 |
1708.60 (-1.8%) |
1697.30 |
1697.30 - 1783.90 |
0.3278 times |
Thu 16 October 2025 |
1740.00 (-0.98%) |
1706.10 |
1698.70 - 1765.00 |
1.1647 times |
Wed 15 October 2025 |
1757.20 (0.56%) |
1738.60 |
1705.20 - 1797.90 |
1.6375 times |
Tue 14 October 2025 |
1747.40 (1.13%) |
1749.00 |
1709.00 - 1750.00 |
0.6672 times |
Weekly price and charts Gkw Strong weekly Stock price targets for Gkw GKWLIMITED are 1771.15 and 1996.95 | Weekly Target 1 | 1600.9 | | Weekly Target 2 | 1715.6 | | Weekly Target 3 | 1826.7 | | Weekly Target 4 | 1941.4 | | Weekly Target 5 | 2052.5 |
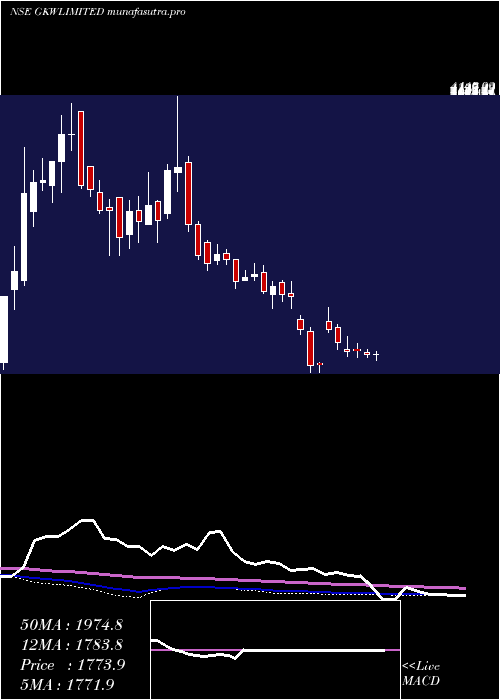
Weekly price and volumes for Gkw
| Date |
Closing |
Open |
Range |
Volume |
Wed 29 October 2025 |
1830.30 (4.59%) |
1799.00 |
1712.00 - 1937.80 |
0.7458 times |
Fri 24 October 2025 |
1749.90 (2.42%) |
1721.50 |
1705.00 - 1819.90 |
0.2235 times |
Fri 17 October 2025 |
1708.60 (-2.14%) |
1790.00 |
1697.30 - 1797.90 |
0.5933 times |
Fri 10 October 2025 |
1745.90 (5.49%) |
1645.10 |
1601.50 - 1985.40 |
5.9063 times |
Fri 03 October 2025 |
1655.00 (-0.1%) |
1685.60 |
1601.00 - 1698.80 |
0.2162 times |
Fri 26 September 2025 |
1656.60 (-0.92%) |
1659.70 |
1649.60 - 1719.00 |
0.2811 times |
Fri 19 September 2025 |
1671.90 (0.96%) |
1657.90 |
1650.10 - 1709.00 |
0.2848 times |
Fri 12 September 2025 |
1656.00 (-5.32%) |
1722.60 |
1630.00 - 1756.10 |
0.805 times |
Fri 05 September 2025 |
1749.00 (3.3%) |
1699.70 |
1652.10 - 1775.00 |
0.5606 times |
Fri 29 August 2025 |
1693.20 (-4.31%) |
1780.00 |
1667.60 - 1810.00 |
0.3833 times |
Fri 22 August 2025 |
1769.40 (8.04%) |
1649.70 |
1632.20 - 1945.00 |
0.8308 times |
Monthly price and charts Gkw Strong monthly Stock price targets for Gkw GKWLIMITED are 1715.9 and 2099.8 | Monthly Target 1 | 1421.83 | | Monthly Target 2 | 1626.07 | | Monthly Target 3 | 1805.7333333333 | | Monthly Target 4 | 2009.97 | | Monthly Target 5 | 2189.63 |
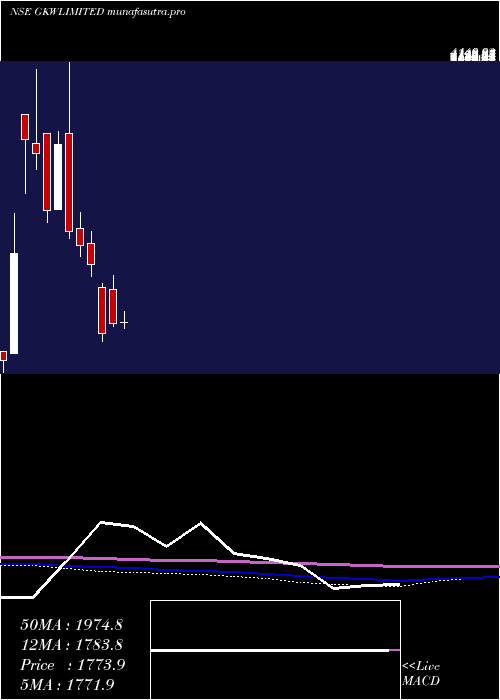
Monthly price and volumes Gkw
| Date |
Closing |
Open |
Range |
Volume |
Wed 29 October 2025 |
1830.30 (11.94%) |
1635.00 |
1601.50 - 1985.40 |
0.9035 times |
Tue 30 September 2025 |
1635.00 (-3.44%) |
1699.70 |
1601.00 - 1775.00 |
0.2526 times |
Fri 29 August 2025 |
1693.20 (-13.57%) |
1970.00 |
1582.30 - 1984.80 |
0.8222 times |
Thu 31 July 2025 |
1959.10 (11.23%) |
1770.00 |
1716.20 - 2168.80 |
2.0105 times |
Mon 30 June 2025 |
1761.30 (5.07%) |
2071.00 |
1740.00 - 2201.00 |
0.9527 times |
Mon 17 February 2025 |
1676.25 (-27.13%) |
2097.00 |
1600.55 - 2134.10 |
0.5565 times |
Fri 31 January 2025 |
2300.25 (-7.3%) |
2491.95 |
2189.95 - 2606.90 |
0.3244 times |
Tue 31 December 2024 |
2481.35 (-4.82%) |
2637.15 |
2376.00 - 2780.05 |
0.6844 times |
Fri 29 November 2024 |
2607.05 (-23.38%) |
3500.00 |
2539.95 - 4149.90 |
2.3635 times |
Thu 31 October 2024 |
3402.45 (21.57%) |
2806.50 |
2804.00 - 3520.05 |
1.1298 times |
Mon 30 September 2024 |
2798.65 (-15.82%) |
3499.00 |
2684.00 - 3499.00 |
1.2199 times |
DMA SMA EMA moving averages of Gkw GKWLIMITED
DMA (daily moving average) of Gkw GKWLIMITED
| DMA period | DMA value | | 5 day DMA | 1763.8 | | 12 day DMA | 1750.41 | | 20 day DMA | 1731.41 | | 35 day DMA | 1708.48 | | 50 day DMA | 1715.39 | | 100 day DMA | 1761.14 | | 150 day DMA | 1950.85 | | 200 day DMA | 2220.72 | EMA (exponential moving average) of Gkw GKWLIMITED
| EMA period | EMA current | EMA prev | EMA prev2 | | 5 day EMA | 1770.24 | 1740.21 | 1751.01 | | 12 day EMA | 1751.48 | 1737.16 | 1740.53 | | 20 day EMA | 1737.97 | 1728.25 | 1729.26 | | 35 day EMA | 1725.72 | 1719.56 | 1719.62 | | 50 day EMA | 1713.05 | 1708.27 | 1707.85 |
SMA (simple moving average) of Gkw GKWLIMITED
| SMA period | SMA current | SMA prev | SMA prev2 | | 5 day SMA | 1763.8 | 1749.22 | 1755 | | 12 day SMA | 1750.41 | 1743.38 | 1742.93 | | 20 day SMA | 1731.41 | 1723.15 | 1720.05 | | 35 day SMA | 1708.48 | 1706.03 | 1706.9 | | 50 day SMA | 1715.39 | 1711.54 | 1709.29 | | 100 day SMA | 1761.14 | 1759.5 | 1759.06 | | 150 day SMA | 1950.85 | 1956.56 | 1963.11 | | 200 day SMA | 2220.72 | 2226.96 | 2233.88 |
|
|
