GkEnergy GKENERGY full analysis,charts,indicators,moving averages,SMA,DMA,EMA,ADX,MACD,RSIGk Energy GKENERGY WideScreen charts, DMA,SMA,EMA technical analysis, forecast prediction, by indicators ADX,MACD,RSI,CCI NSE stock exchange
Daily price and charts and targets GkEnergy Strong Daily Stock price targets for GkEnergy GKENERGY are 192.82 and 205.21 | Daily Target 1 | 190.48 | | Daily Target 2 | 195.16 | | Daily Target 3 | 202.87333333333 | | Daily Target 4 | 207.55 | | Daily Target 5 | 215.26 |
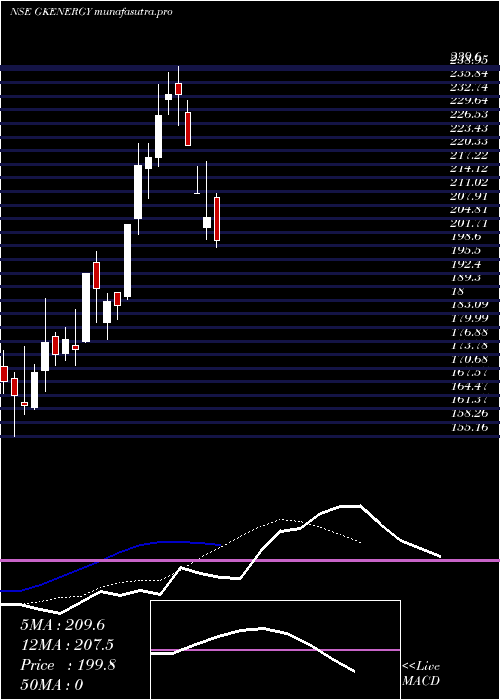
Daily price and volume Gk Energy
| Date |
Closing |
Open |
Range |
Volume |
Wed 29 October 2025 |
199.83 (-2.61%) |
209.64 |
198.20 - 210.59 |
0.2923 times |
Tue 28 October 2025 |
205.19 (-2.51%) |
202.90 |
199.95 - 217.95 |
1.3471 times |
Mon 27 October 2025 |
210.48 (-5%) |
210.48 |
210.48 - 216.78 |
0.1824 times |
Fri 24 October 2025 |
221.56 (-5%) |
229.01 |
221.56 - 231.81 |
0.505 times |
Thu 23 October 2025 |
233.23 (0.08%) |
235.59 |
226.06 - 239.60 |
0.8755 times |
Tue 21 October 2025 |
233.04 (2.03%) |
231.98 |
228.60 - 238.24 |
0.3866 times |
Mon 20 October 2025 |
228.41 (4.43%) |
218.71 |
216.66 - 235.50 |
1.3964 times |
Fri 17 October 2025 |
218.72 (0.8%) |
216.21 |
209.43 - 222.00 |
0.8843 times |
Thu 16 October 2025 |
216.99 (6.7%) |
204.90 |
201.31 - 222.00 |
2.3077 times |
Wed 15 October 2025 |
203.37 (9.92%) |
187.00 |
186.40 - 203.52 |
1.8227 times |
Tue 14 October 2025 |
185.02 (-0.53%) |
188.00 |
181.75 - 188.00 |
0.6486 times |
Weekly price and charts GkEnergy Strong weekly Stock price targets for GkEnergy GKENERGY are 189.14 and 208.89 | Weekly Target 1 | 185.58 | | Weekly Target 2 | 192.7 | | Weekly Target 3 | 205.32666666667 | | Weekly Target 4 | 212.45 | | Weekly Target 5 | 225.08 |
Weekly price and volumes for Gk Energy
| Date |
Closing |
Open |
Range |
Volume |
Wed 29 October 2025 |
199.83 (-9.81%) |
210.48 |
198.20 - 217.95 |
0.3499 times |
Fri 24 October 2025 |
221.56 (1.3%) |
218.71 |
216.66 - 239.60 |
0.6075 times |
Fri 17 October 2025 |
218.72 (15.84%) |
181.10 |
177.27 - 222.00 |
1.3843 times |
Fri 10 October 2025 |
188.81 (6.94%) |
177.96 |
171.31 - 197.35 |
1.3459 times |
Fri 03 October 2025 |
176.55 (0%) |
168.35 |
155.16 - 186.59 |
1.3125 times |
Wed 29 October 2025 |
(0%) |
|
- |
0 times |

Monthly price and charts GkEnergy Strong monthly Stock price targets for GkEnergy GKENERGY are 180.51 and 258.92 | Monthly Target 1 | 121.8 | | Monthly Target 2 | 160.81 | | Monthly Target 3 | 200.20666666667 | | Monthly Target 4 | 239.22 | | Monthly Target 5 | 278.62 |
Monthly price and volumes Gk Energy
| Date |
Closing |
Open |
Range |
Volume |
Wed 29 October 2025 |
199.83 (23.28%) |
161.70 |
161.19 - 239.60 |
1.2595 times |
Tue 30 September 2025 |
162.10 (0%) |
171.00 |
155.16 - 175.65 |
0.7405 times |
Wed 29 October 2025 |
(0%) |
|
- |
0 times |

DMA SMA EMA moving averages of Gk Energy GKENERGY
DMA (daily moving average) of Gk Energy GKENERGY
| DMA period | DMA value | | 5 day DMA | 214.06 | | 12 day DMA | 211.82 | | 20 day DMA | 197.85 | | 35 day DMA | | | 50 day DMA | | | 100 day DMA | | | 150 day DMA | | | 200 day DMA | | EMA (exponential moving average) of Gk Energy GKENERGY
| EMA period | EMA current | EMA prev | EMA prev2 | | 5 day EMA | 209.59 | 214.47 | 219.11 | | 12 day EMA | 207.52 | 208.92 | 209.6 | | 20 day EMA | 195.7 | 195.26 | 194.21 | | 35 day EMA | 0 | 0 | 0 | | 50 day EMA | 0 | 0 | 0 |
SMA (simple moving average) of Gk Energy GKENERGY
| SMA period | SMA current | SMA prev | SMA prev2 | | 5 day SMA | 214.06 | 220.7 | 225.34 | | 12 day SMA | 211.82 | 210.9 | 209.83 | | 20 day SMA | 197.85 | | 35 day SMA | | 50 day SMA | | 100 day SMA | | 150 day SMA | | 200 day SMA |
|
|
