GirirajCivil GIRIRAJ_SM full analysis,charts,indicators,moving averages,SMA,DMA,EMA,ADX,MACD,RSIGiriraj Civil GIRIRAJ_SM WideScreen charts, DMA,SMA,EMA technical analysis, forecast prediction, by indicators ADX,MACD,RSI,CCI NSE stock exchange
Daily price and charts and targets GirirajCivil Strong Daily Stock price targets for GirirajCivil GIRIRAJ_SM are 221.05 and 232.35 | Daily Target 1 | 219.17 | | Daily Target 2 | 222.93 | | Daily Target 3 | 230.46666666667 | | Daily Target 4 | 234.23 | | Daily Target 5 | 241.77 |
Daily price and volume Giriraj Civil
| Date |
Closing |
Open |
Range |
Volume |
Tue 28 October 2025 |
226.70 (-4.87%) |
231.00 |
226.70 - 238.00 |
1.1565 times |
Mon 27 October 2025 |
238.30 (-4.18%) |
239.50 |
236.50 - 248.70 |
3.1973 times |
Fri 24 October 2025 |
248.70 (-4.99%) |
253.00 |
248.70 - 253.00 |
1.0884 times |
Thu 23 October 2025 |
261.75 (-4.99%) |
264.00 |
261.75 - 264.00 |
0.4082 times |
Mon 20 October 2025 |
275.50 (-5%) |
291.45 |
275.50 - 291.45 |
1.0204 times |
Fri 17 October 2025 |
290.00 (-2.99%) |
284.00 |
284.00 - 290.00 |
1.0884 times |
Thu 16 October 2025 |
298.95 (-4.99%) |
313.95 |
298.95 - 313.95 |
0.2041 times |
Wed 15 October 2025 |
314.65 (-5%) |
316.90 |
314.65 - 316.90 |
0.9524 times |
Tue 14 October 2025 |
331.20 (-4.47%) |
331.20 |
331.20 - 331.25 |
0.2041 times |
Mon 13 October 2025 |
346.70 (-2.61%) |
356.00 |
338.20 - 356.00 |
0.6803 times |
Fri 10 October 2025 |
356.00 (-1.11%) |
369.00 |
356.00 - 369.00 |
0.1361 times |
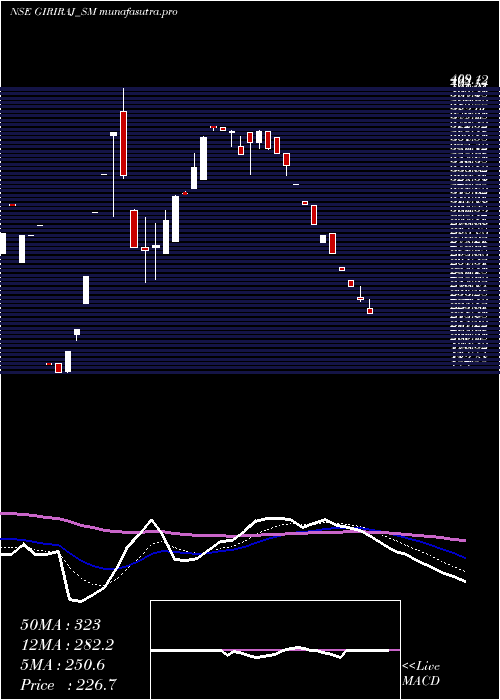
Weekly price and charts GirirajCivil Strong weekly Stock price targets for GirirajCivil GIRIRAJ_SM are 215.7 and 237.7 | Weekly Target 1 | 212.03 | | Weekly Target 2 | 219.37 | | Weekly Target 3 | 234.03333333333 | | Weekly Target 4 | 241.37 | | Weekly Target 5 | 256.03 |
Weekly price and volumes for Giriraj Civil
| Date |
Closing |
Open |
Range |
Volume |
Tue 28 October 2025 |
226.70 (-8.85%) |
239.50 |
226.70 - 248.70 |
0.7281 times |
Fri 24 October 2025 |
248.70 (-14.24%) |
291.45 |
248.70 - 291.45 |
0.4209 times |
Fri 17 October 2025 |
290.00 (-18.54%) |
356.00 |
284.00 - 356.00 |
0.5233 times |
Fri 10 October 2025 |
356.00 (-4.8%) |
362.10 |
339.00 - 374.95 |
0.5006 times |
Fri 03 October 2025 |
373.95 (-0.28%) |
373.00 |
362.05 - 375.00 |
0.0455 times |
Fri 26 September 2025 |
375.00 (16.6%) |
324.00 |
323.90 - 378.00 |
0.9443 times |
Fri 19 September 2025 |
321.60 (-4.92%) |
310.00 |
252.00 - 322.00 |
4.7668 times |
Thu 22 May 2025 |
338.25 (31.72%) |
308.15 |
305.50 - 409.00 |
1.5927 times |
Fri 16 May 2025 |
256.80 (-13.81%) |
186.00 |
179.00 - 256.80 |
0.3754 times |
Wed 08 January 2025 |
297.95 (-5.08%) |
268.10 |
268.10 - 298.00 |
0.1024 times |
Fri 03 January 2025 |
313.90 (-0.35%) |
315.00 |
275.10 - 315.00 |
2.0705 times |

Monthly price and charts GirirajCivil Strong monthly Stock price targets for GirirajCivil GIRIRAJ_SM are 152.55 and 300.85 | Monthly Target 1 | 127.83 | | Monthly Target 2 | 177.27 | | Monthly Target 3 | 276.13333333333 | | Monthly Target 4 | 325.57 | | Monthly Target 5 | 424.43 |
Monthly price and volumes Giriraj Civil
| Date |
Closing |
Open |
Range |
Volume |
Tue 28 October 2025 |
226.70 (-39.55%) |
373.00 |
226.70 - 375.00 |
1.022 times |
Fri 26 September 2025 |
375.00 (10.86%) |
310.00 |
252.00 - 378.00 |
2.631 times |
Thu 22 May 2025 |
338.25 (13.53%) |
186.00 |
179.00 - 409.00 |
0.9067 times |
Wed 08 January 2025 |
297.95 (-5.38%) |
275.10 |
268.10 - 315.00 |
0.5241 times |
Tue 31 December 2024 |
314.90 (-18.21%) |
385.00 |
300.00 - 392.50 |
0.9696 times |
Fri 29 November 2024 |
385.00 (-3.58%) |
408.00 |
321.25 - 408.00 |
0.3249 times |
Wed 30 October 2024 |
399.30 (4.01%) |
385.10 |
326.00 - 415.00 |
0.4088 times |
Mon 30 September 2024 |
383.90 (-4.03%) |
401.00 |
355.00 - 412.00 |
0.6499 times |
Fri 30 August 2024 |
400.00 (5.54%) |
396.50 |
330.00 - 420.00 |
2.3795 times |
Wed 31 July 2024 |
379.00 (-11.66%) |
382.60 |
343.00 - 382.60 |
0.1834 times |
Mon 06 November 2023 |
429.00 (-78.16%) |
1980.00 |
409.25 - 2050.00 |
0.1593 times |

DMA SMA EMA moving averages of Giriraj Civil GIRIRAJ_SM
DMA (daily moving average) of Giriraj Civil GIRIRAJ_SM
| DMA period | DMA value | | 5 day DMA | 250.19 | | 12 day DMA | 295.7 | | 20 day DMA | 324.13 | | 35 day DMA | 304.54 | | 50 day DMA | 307.96 | | 100 day DMA | 351.09 | | 150 day DMA | 541.4 | | 200 day DMA | 510.15 | EMA (exponential moving average) of Giriraj Civil GIRIRAJ_SM
| EMA period | EMA current | EMA prev | EMA prev2 | | 5 day EMA | 250.56 | 262.49 | 274.58 | | 12 day EMA | 282.24 | 292.34 | 302.16 | | 20 day EMA | 297.95 | 305.45 | 312.52 | | 35 day EMA | 308.85 | 313.69 | 318.13 | | 50 day EMA | 308.01 | 311.33 | 314.31 |
SMA (simple moving average) of Giriraj Civil GIRIRAJ_SM
| SMA period | SMA current | SMA prev | SMA prev2 | | 5 day SMA | 250.19 | 262.85 | 274.98 | | 12 day SMA | 295.7 | 307.97 | 318.53 | | 20 day SMA | 324.13 | 328.99 | 333.15 | | 35 day SMA | 304.54 | 306.57 | 308.05 | | 50 day SMA | 307.96 | 310.61 | 313.64 | | 100 day SMA | 351.09 | 352.84 | 354.47 | | 150 day SMA | 541.4 | 546.3 | 550.81 | | 200 day SMA | 510.15 | 510.08 | 510 |
|
|
