GujaratIndustries GIPCL full analysis,charts,indicators,moving averages,SMA,DMA,EMA,ADX,MACD,RSIGujarat Industries GIPCL WideScreen charts, DMA,SMA,EMA technical analysis, forecast prediction, by indicators ADX,MACD,RSI,CCI NSE stock exchange
operates under Electric Utilities sector
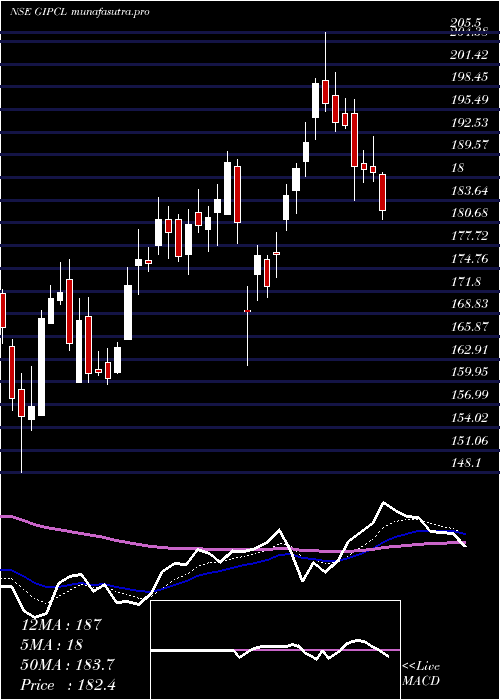
Daily price and charts and targets GujaratIndustries Strong Daily Stock price targets for GujaratIndustries GIPCL are 183.6 and 187.06 | Daily Target 1 | 180.83 | | Daily Target 2 | 182.91 | | Daily Target 3 | 184.28666666667 | | Daily Target 4 | 186.37 | | Daily Target 5 | 187.75 |
Daily price and volume Gujarat Industries
| Date |
Closing |
Open |
Range |
Volume |
Wed 29 October 2025 |
185.00 (1.73%) |
182.58 |
182.20 - 185.66 |
0.4003 times |
Tue 28 October 2025 |
181.85 (-0.44%) |
182.70 |
181.02 - 184.00 |
0.2997 times |
Mon 27 October 2025 |
182.65 (0.19%) |
183.50 |
181.61 - 183.90 |
0.3734 times |
Fri 24 October 2025 |
182.30 (-4.36%) |
190.00 |
181.65 - 191.95 |
2.7325 times |
Thu 23 October 2025 |
190.61 (2.48%) |
186.49 |
182.60 - 198.00 |
1.816 times |
Tue 21 October 2025 |
186.00 (0.74%) |
186.70 |
184.55 - 187.84 |
0.1877 times |
Mon 20 October 2025 |
184.63 (6.51%) |
174.20 |
174.00 - 187.38 |
2.725 times |
Fri 17 October 2025 |
173.34 (-1.01%) |
175.60 |
172.53 - 176.08 |
0.3041 times |
Thu 16 October 2025 |
175.10 (0.09%) |
175.63 |
173.51 - 177.87 |
0.3718 times |
Wed 15 October 2025 |
174.94 (-0.95%) |
176.65 |
173.69 - 179.51 |
0.7896 times |
Tue 14 October 2025 |
176.61 (-2.57%) |
181.25 |
175.60 - 182.98 |
0.4841 times |
Weekly price and charts GujaratIndustries Strong weekly Stock price targets for GujaratIndustries GIPCL are 183.01 and 187.65 | Weekly Target 1 | 179.25 | | Weekly Target 2 | 182.13 | | Weekly Target 3 | 183.89333333333 | | Weekly Target 4 | 186.77 | | Weekly Target 5 | 188.53 |
Weekly price and volumes for Gujarat Industries
| Date |
Closing |
Open |
Range |
Volume |
Wed 29 October 2025 |
185.00 (1.48%) |
183.50 |
181.02 - 185.66 |
0.4381 times |
Fri 24 October 2025 |
182.30 (5.17%) |
174.20 |
174.00 - 198.00 |
3.0449 times |
Fri 17 October 2025 |
173.34 (-5.83%) |
183.00 |
172.53 - 183.69 |
0.9127 times |
Fri 10 October 2025 |
184.07 (-0.53%) |
184.55 |
180.00 - 188.80 |
0.6688 times |
Fri 03 October 2025 |
185.06 (0.82%) |
183.55 |
179.71 - 185.52 |
0.4647 times |
Fri 26 September 2025 |
183.55 (-2.27%) |
187.81 |
181.80 - 194.85 |
0.7646 times |
Fri 19 September 2025 |
187.81 (0.56%) |
187.40 |
186.85 - 192.50 |
0.6474 times |
Fri 12 September 2025 |
186.77 (-3.93%) |
195.00 |
185.64 - 200.10 |
1.6098 times |
Fri 05 September 2025 |
194.41 (9.31%) |
181.99 |
180.99 - 202.05 |
1.0541 times |
Fri 29 August 2025 |
177.85 (-5.23%) |
189.16 |
176.61 - 189.40 |
0.3949 times |
Fri 22 August 2025 |
187.66 (1.4%) |
185.99 |
184.51 - 193.90 |
0.4972 times |
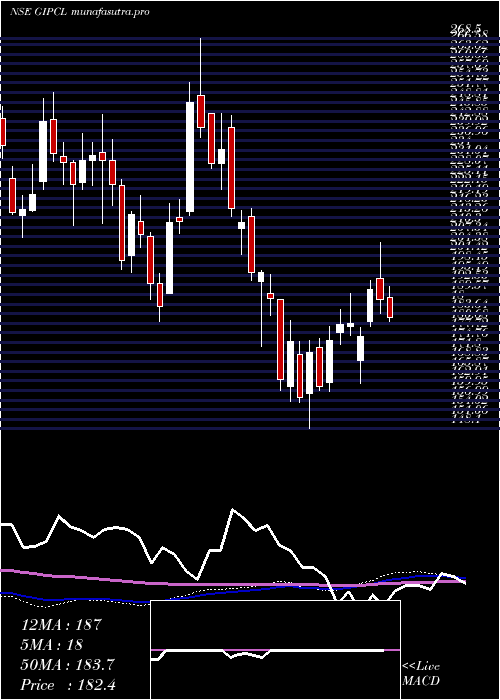
Monthly price and charts GujaratIndustries Strong monthly Stock price targets for GujaratIndustries GIPCL are 178.77 and 204.24 | Monthly Target 1 | 159.71 | | Monthly Target 2 | 172.35 | | Monthly Target 3 | 185.17666666667 | | Monthly Target 4 | 197.82 | | Monthly Target 5 | 210.65 |
Monthly price and volumes Gujarat Industries
| Date |
Closing |
Open |
Range |
Volume |
Wed 29 October 2025 |
185.00 (2.05%) |
180.25 |
172.53 - 198.00 |
0.9653 times |
Tue 30 September 2025 |
181.29 (1.93%) |
181.99 |
179.71 - 202.05 |
0.7848 times |
Fri 29 August 2025 |
177.85 (-11.45%) |
202.30 |
176.61 - 202.30 |
0.3958 times |
Thu 31 July 2025 |
200.85 (-8.16%) |
219.40 |
193.61 - 223.90 |
0.993 times |
Mon 30 June 2025 |
218.69 (11.85%) |
196.00 |
190.21 - 220.60 |
1.3886 times |
Fri 30 May 2025 |
195.52 (7.22%) |
182.49 |
169.50 - 210.77 |
0.9135 times |
Wed 30 April 2025 |
182.35 (1.08%) |
179.80 |
162.12 - 205.50 |
1.1301 times |
Fri 28 March 2025 |
180.41 (14.33%) |
158.99 |
148.10 - 184.99 |
1.3797 times |
Fri 28 February 2025 |
157.80 (-19.6%) |
190.00 |
156.26 - 195.70 |
0.7615 times |
Fri 31 January 2025 |
196.26 (-13.84%) |
227.05 |
173.42 - 245.20 |
1.2876 times |
Tue 31 December 2024 |
227.78 (7.62%) |
213.34 |
208.28 - 268.50 |
2.5893 times |

DMA SMA EMA moving averages of Gujarat Industries GIPCL
DMA (daily moving average) of Gujarat Industries GIPCL
| DMA period | DMA value | | 5 day DMA | 184.48 | | 12 day DMA | 181.19 | | 20 day DMA | 181.82 | | 35 day DMA | 185.13 | | 50 day DMA | 186.3 | | 100 day DMA | 195.22 | | 150 day DMA | 192.65 | | 200 day DMA | 190.26 | EMA (exponential moving average) of Gujarat Industries GIPCL
| EMA period | EMA current | EMA prev | EMA prev2 | | 5 day EMA | 183.56 | 182.84 | 183.34 | | 12 day EMA | 182.8 | 182.4 | 182.5 | | 20 day EMA | 183.05 | 182.85 | 182.95 | | 35 day EMA | 184.37 | 184.33 | 184.48 | | 50 day EMA | 186.42 | 186.48 | 186.67 |
SMA (simple moving average) of Gujarat Industries GIPCL
| SMA period | SMA current | SMA prev | SMA prev2 | | 5 day SMA | 184.48 | 184.68 | 185.24 | | 12 day SMA | 181.19 | 181.11 | 181.09 | | 20 day SMA | 181.82 | 181.7 | 181.78 | | 35 day SMA | 185.13 | 185.44 | 185.8 | | 50 day SMA | 186.3 | 186.3 | 186.43 | | 100 day SMA | 195.22 | 195.34 | 195.48 | | 150 day SMA | 192.65 | 192.59 | 192.53 | | 200 day SMA | 190.26 | 190.51 | 190.73 |
|
|
