GillandersArbuthnot GILLANDERS full analysis,charts,indicators,moving averages,SMA,DMA,EMA,ADX,MACD,RSIGillanders Arbuthnot GILLANDERS WideScreen charts, DMA,SMA,EMA technical analysis, forecast prediction, by indicators ADX,MACD,RSI,CCI NSE stock exchange
operates under Diversified sector
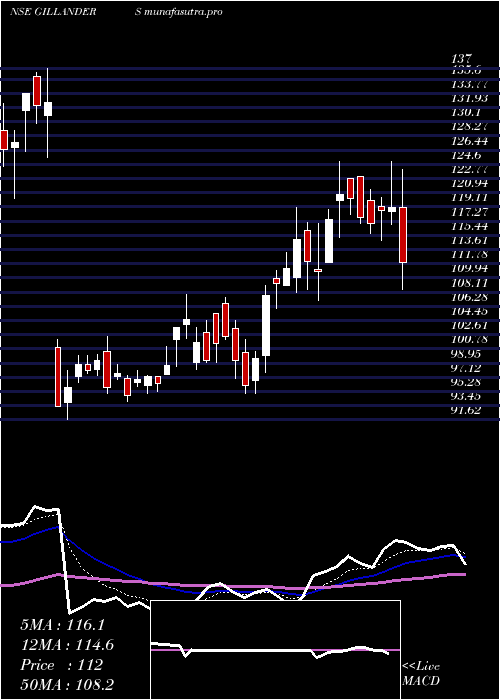
Daily price and charts and targets GillandersArbuthnot Strong Daily Stock price targets for GillandersArbuthnot GILLANDERS are 120.14 and 123.84 | Daily Target 1 | 119.35 | | Daily Target 2 | 120.92 | | Daily Target 3 | 123.05333333333 | | Daily Target 4 | 124.62 | | Daily Target 5 | 126.75 |
Daily price and volume Gillanders Arbuthnot
| Date |
Closing |
Open |
Range |
Volume |
Wed 29 October 2025 |
122.48 (-1.66%) |
125.19 |
121.49 - 125.19 |
0.7397 times |
Tue 28 October 2025 |
124.55 (0.04%) |
126.51 |
123.06 - 126.60 |
0.6823 times |
Mon 27 October 2025 |
124.50 (0.34%) |
127.89 |
123.35 - 127.89 |
1.4804 times |
Fri 24 October 2025 |
124.08 (-0.91%) |
125.25 |
122.70 - 128.00 |
0.7675 times |
Thu 23 October 2025 |
125.22 (0.81%) |
124.23 |
122.75 - 128.97 |
1.5193 times |
Tue 21 October 2025 |
124.22 (0.47%) |
123.64 |
122.15 - 125.95 |
0.1443 times |
Mon 20 October 2025 |
123.64 (-0.36%) |
122.90 |
122.30 - 126.99 |
0.9223 times |
Fri 17 October 2025 |
124.09 (-0.58%) |
126.93 |
123.00 - 127.11 |
0.9164 times |
Thu 16 October 2025 |
124.82 (-1.09%) |
126.00 |
124.00 - 129.40 |
2.0639 times |
Wed 15 October 2025 |
126.19 (0.96%) |
125.00 |
123.00 - 128.00 |
0.7639 times |
Tue 14 October 2025 |
124.99 (-0.89%) |
126.11 |
123.20 - 126.50 |
0.4951 times |
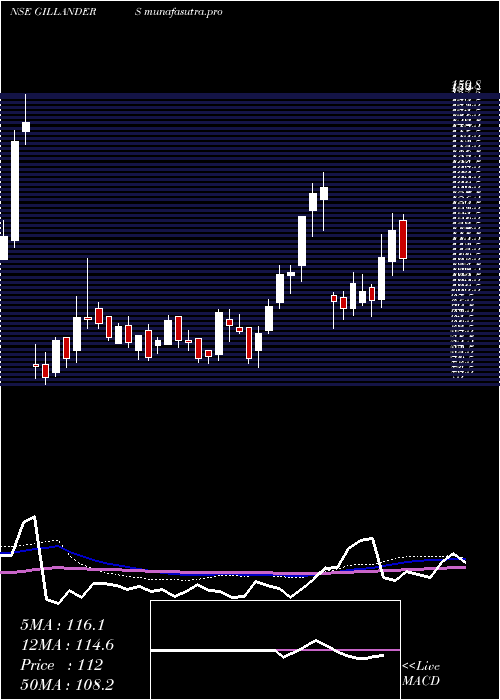
Weekly price and charts GillandersArbuthnot Strong weekly Stock price targets for GillandersArbuthnot GILLANDERS are 118.79 and 125.19 | Weekly Target 1 | 117.55 | | Weekly Target 2 | 120.02 | | Weekly Target 3 | 123.95333333333 | | Weekly Target 4 | 126.42 | | Weekly Target 5 | 130.35 |
Weekly price and volumes for Gillanders Arbuthnot
| Date |
Closing |
Open |
Range |
Volume |
Wed 29 October 2025 |
122.48 (-1.29%) |
127.89 |
121.49 - 127.89 |
0.4769 times |
Fri 24 October 2025 |
124.08 (-0.01%) |
122.90 |
122.15 - 128.97 |
0.551 times |
Fri 17 October 2025 |
124.09 (-2.21%) |
128.00 |
123.00 - 129.40 |
0.8476 times |
Fri 10 October 2025 |
126.90 (7.86%) |
120.00 |
115.60 - 128.00 |
1.2951 times |
Fri 03 October 2025 |
117.65 (9.48%) |
110.10 |
110.10 - 124.90 |
1.653 times |
Fri 26 September 2025 |
107.46 (-10.43%) |
114.20 |
106.00 - 121.99 |
0.5253 times |
Fri 19 September 2025 |
119.97 (-0.86%) |
120.41 |
116.10 - 124.41 |
1.0797 times |
Fri 12 September 2025 |
121.01 (-0.4%) |
121.20 |
120.08 - 127.99 |
0.5991 times |
Fri 05 September 2025 |
121.50 (6.43%) |
115.98 |
113.19 - 131.89 |
1.5929 times |
Fri 29 August 2025 |
114.16 (-5.41%) |
121.01 |
111.10 - 127.72 |
1.3793 times |
Fri 22 August 2025 |
120.69 (0.31%) |
117.99 |
117.99 - 125.97 |
1.2483 times |
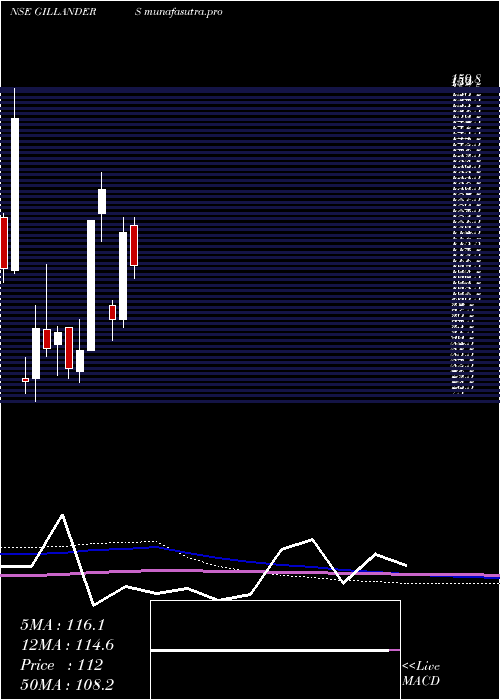
Monthly price and charts GillandersArbuthnot Strong monthly Stock price targets for GillandersArbuthnot GILLANDERS are 117.49 and 134.39 | Monthly Target 1 | 104.56 | | Monthly Target 2 | 113.52 | | Monthly Target 3 | 121.46 | | Monthly Target 4 | 130.42 | | Monthly Target 5 | 138.36 |
Monthly price and volumes Gillanders Arbuthnot
| Date |
Closing |
Open |
Range |
Volume |
Wed 29 October 2025 |
122.48 (5.81%) |
115.75 |
112.50 - 129.40 |
0.2895 times |
Tue 30 September 2025 |
115.75 (1.39%) |
115.98 |
106.00 - 131.89 |
0.4541 times |
Fri 29 August 2025 |
114.16 (-21.86%) |
148.20 |
111.10 - 151.90 |
0.9305 times |
Thu 31 July 2025 |
146.10 (6.03%) |
139.41 |
123.51 - 151.00 |
1.9453 times |
Mon 30 June 2025 |
137.79 (9.65%) |
126.92 |
124.03 - 150.05 |
2.8505 times |
Fri 30 May 2025 |
125.66 (4.07%) |
122.80 |
106.10 - 127.50 |
0.6708 times |
Wed 30 April 2025 |
120.75 (24.23%) |
97.20 |
95.00 - 125.00 |
0.3089 times |
Fri 28 March 2025 |
97.20 (-26.66%) |
101.00 |
91.62 - 102.37 |
0.0939 times |
Fri 13 December 2024 |
132.54 (6.84%) |
125.95 |
118.24 - 137.00 |
0.7337 times |
Fri 29 November 2024 |
124.05 (39.71%) |
88.80 |
88.70 - 124.05 |
1.7227 times |
Thu 31 October 2024 |
88.79 (5.78%) |
83.03 |
80.20 - 97.14 |
0.3924 times |
DMA SMA EMA moving averages of Gillanders Arbuthnot GILLANDERS
DMA (daily moving average) of Gillanders Arbuthnot GILLANDERS
| DMA period | DMA value | | 5 day DMA | 124.17 | | 12 day DMA | 124.57 | | 20 day DMA | 122.56 | | 35 day DMA | 120.6 | | 50 day DMA | 120.82 | | 100 day DMA | 126.98 | | 150 day DMA | 121.67 | | 200 day DMA | 117.07 | EMA (exponential moving average) of Gillanders Arbuthnot GILLANDERS
| EMA period | EMA current | EMA prev | EMA prev2 | | 5 day EMA | 123.81 | 124.48 | 124.44 | | 12 day EMA | 123.61 | 123.82 | 123.69 | | 20 day EMA | 122.79 | 122.82 | 122.64 | | 35 day EMA | 122.13 | 122.11 | 121.97 | | 50 day EMA | 121.1 | 121.04 | 120.9 |
SMA (simple moving average) of Gillanders Arbuthnot GILLANDERS
| SMA period | SMA current | SMA prev | SMA prev2 | | 5 day SMA | 124.17 | 124.51 | 124.33 | | 12 day SMA | 124.57 | 124.94 | 125.11 | | 20 day SMA | 122.56 | 122.22 | 121.37 | | 35 day SMA | 120.6 | 120.67 | 120.58 | | 50 day SMA | 120.82 | 120.78 | 120.73 | | 100 day SMA | 126.98 | 127.03 | 127.04 | | 150 day SMA | 121.67 | 121.51 | 121.34 | | 200 day SMA | 117.07 | 116.91 | 116.74 |
|
|
