GlobeIntl GICL_SM full analysis,charts,indicators,moving averages,SMA,DMA,EMA,ADX,MACD,RSIGlobe Intl GICL_SM WideScreen charts, DMA,SMA,EMA technical analysis, forecast prediction, by indicators ADX,MACD,RSI,CCI NSE stock exchange
operates under REAL_ESTATE_INVESTMENT_TRUST sector
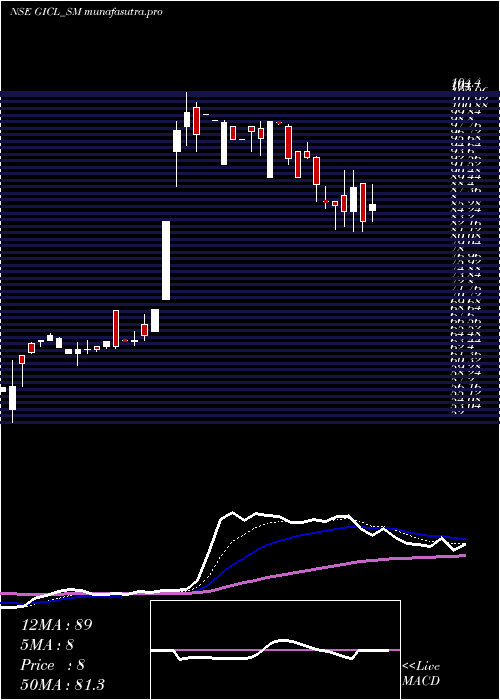
Daily price and charts and targets GlobeIntl Strong Daily Stock price targets for GlobeIntl GICL_SM are 41.6 and 43.1 | Daily Target 1 | 41.23 | | Daily Target 2 | 41.97 | | Daily Target 3 | 42.733333333333 | | Daily Target 4 | 43.47 | | Daily Target 5 | 44.23 |
Daily price and volume Globe Intl
| Date |
Closing |
Open |
Range |
Volume |
Tue 28 October 2025 |
42.70 (-1.39%) |
43.50 |
42.00 - 43.50 |
0.8247 times |
Mon 27 October 2025 |
43.30 (2.24%) |
43.00 |
40.30 - 44.00 |
1.3323 times |
Fri 24 October 2025 |
42.35 (-4.62%) |
45.35 |
42.00 - 45.35 |
0.8882 times |
Thu 23 October 2025 |
44.40 (-3.27%) |
45.00 |
43.50 - 45.40 |
0.6027 times |
Tue 21 October 2025 |
45.90 (0.99%) |
45.45 |
44.50 - 46.50 |
0.6661 times |
Mon 20 October 2025 |
45.45 (-1.84%) |
46.75 |
43.00 - 46.75 |
1.6812 times |
Fri 17 October 2025 |
46.30 (-0.43%) |
47.00 |
45.25 - 47.00 |
0.3807 times |
Thu 16 October 2025 |
46.50 (0%) |
48.00 |
45.50 - 48.90 |
2.0936 times |
Wed 15 October 2025 |
46.50 (-73.23%) |
46.00 |
46.00 - 46.50 |
1.2371 times |
Tue 14 October 2025 |
173.70 (-0.71%) |
174.95 |
171.00 - 177.00 |
0.2934 times |
Mon 13 October 2025 |
174.95 (-0.82%) |
176.40 |
171.80 - 179.00 |
0.3489 times |
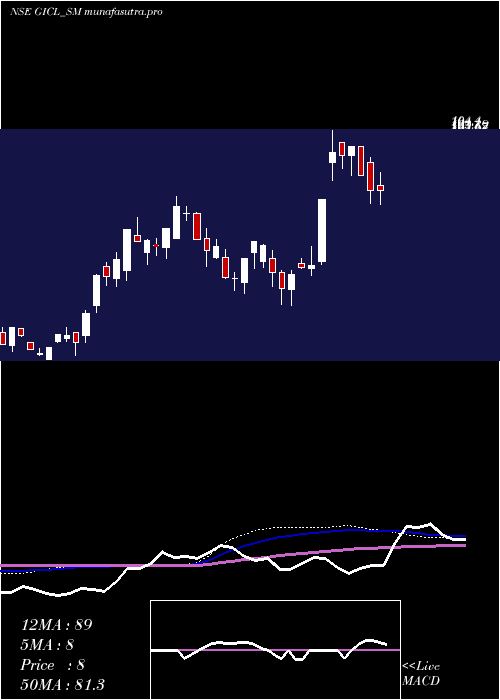
Weekly price and charts GlobeIntl Strong weekly Stock price targets for GlobeIntl GICL_SM are 39.65 and 43.35 | Weekly Target 1 | 38.63 | | Weekly Target 2 | 40.67 | | Weekly Target 3 | 42.333333333333 | | Weekly Target 4 | 44.37 | | Weekly Target 5 | 46.03 |
Weekly price and volumes for Globe Intl
| Date |
Closing |
Open |
Range |
Volume |
Tue 28 October 2025 |
42.70 (0.83%) |
43.00 |
40.30 - 44.00 |
0.8341 times |
Fri 24 October 2025 |
42.35 (-8.53%) |
46.75 |
42.00 - 46.75 |
1.4842 times |
Fri 17 October 2025 |
46.30 (-73.75%) |
176.40 |
45.25 - 179.00 |
1.6835 times |
Fri 10 October 2025 |
176.40 (8.09%) |
163.20 |
157.25 - 177.00 |
0.7268 times |
Fri 03 October 2025 |
163.20 (-0.37%) |
164.50 |
160.00 - 169.00 |
0.4661 times |
Fri 26 September 2025 |
163.80 (11.69%) |
148.00 |
146.50 - 169.95 |
1.1898 times |
Fri 19 September 2025 |
146.65 (19.08%) |
122.70 |
118.25 - 148.70 |
1.4811 times |
Fri 12 September 2025 |
123.15 (-2.46%) |
125.95 |
119.05 - 126.45 |
0.8678 times |
Fri 05 September 2025 |
126.25 (8.84%) |
118.00 |
113.25 - 137.00 |
0.8954 times |
Fri 29 August 2025 |
116.00 (-2.07%) |
117.50 |
114.20 - 122.00 |
0.3711 times |
Fri 22 August 2025 |
118.45 (-0.46%) |
117.50 |
112.00 - 120.00 |
0.4017 times |
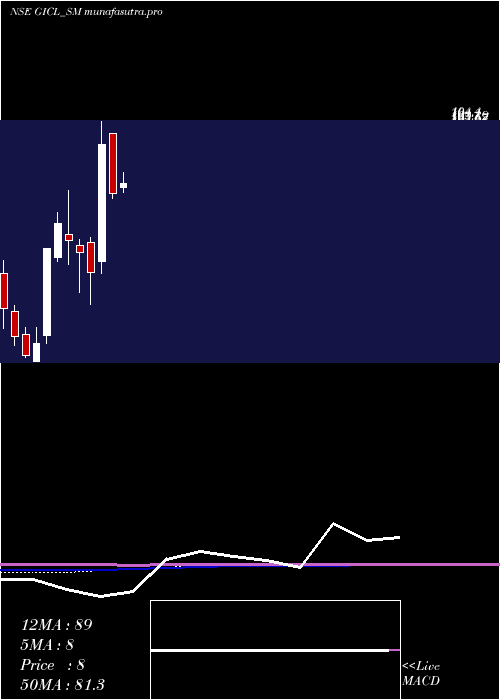
Monthly price and charts GlobeIntl Strong monthly Stock price targets for GlobeIntl GICL_SM are -27.85 and 110.85 | Monthly Target 1 | -51.37 | | Monthly Target 2 | -4.33 | | Monthly Target 3 | 87.333333333333 | | Monthly Target 4 | 134.37 | | Monthly Target 5 | 226.03 |
Monthly price and volumes Globe Intl
| Date |
Closing |
Open |
Range |
Volume |
Tue 28 October 2025 |
42.70 (-74.06%) |
164.60 |
40.30 - 179.00 |
1.4526 times |
Tue 30 September 2025 |
164.60 (41.9%) |
118.00 |
113.25 - 169.95 |
1.4053 times |
Fri 29 August 2025 |
116.00 (-4.01%) |
118.05 |
112.00 - 122.00 |
0.4505 times |
Thu 31 July 2025 |
120.85 (-0.86%) |
120.90 |
105.00 - 128.00 |
0.6462 times |
Mon 30 June 2025 |
121.90 (17.21%) |
104.10 |
104.10 - 129.80 |
0.6417 times |
Fri 30 May 2025 |
104.00 (23.88%) |
85.65 |
84.00 - 114.90 |
1.0849 times |
Wed 30 April 2025 |
83.95 (-14.16%) |
101.00 |
82.30 - 101.00 |
0.74 times |
Thu 26 December 2024 |
97.80 (59.41%) |
64.50 |
61.00 - 104.40 |
2.2581 times |
Fri 29 November 2024 |
61.35 (-8.43%) |
69.75 |
52.00 - 71.10 |
0.5607 times |
Thu 31 October 2024 |
67.00 (-4.83%) |
69.00 |
55.50 - 70.70 |
0.76 times |
Mon 30 September 2024 |
70.40 (-6.32%) |
72.05 |
63.55 - 84.75 |
1.6183 times |
DMA SMA EMA moving averages of Globe Intl GICL_SM
DMA (daily moving average) of Globe Intl GICL_SM
| DMA period | DMA value | | 5 day DMA | 43.73 | | 12 day DMA | 77.37 | | 20 day DMA | 112.12 | | 35 day DMA | 123.09 | | 50 day DMA | 122 | | 100 day DMA | 120.65 | | 150 day DMA | 112.24 | | 200 day DMA | 99.98 | EMA (exponential moving average) of Globe Intl GICL_SM
| EMA period | EMA current | EMA prev | EMA prev2 | | 5 day EMA | 46.87 | 48.95 | 51.77 | | 12 day EMA | 71.23 | 76.41 | 82.43 | | 20 day EMA | 90.84 | 95.9 | 101.43 | | 35 day EMA | 105.3 | 108.99 | 112.86 | | 50 day EMA | 113.93 | 116.84 | 119.84 |
SMA (simple moving average) of Globe Intl GICL_SM
| SMA period | SMA current | SMA prev | SMA prev2 | | 5 day SMA | 43.73 | 44.28 | 44.88 | | 12 day SMA | 77.37 | 87.72 | 97.88 | | 20 day SMA | 112.12 | 118.18 | 124.29 | | 35 day SMA | 123.09 | 125.48 | 127.83 | | 50 day SMA | 122 | 123.53 | 125.04 | | 100 day SMA | 120.65 | 121.36 | 122.03 | | 150 day SMA | 112.24 | 112.38 | 112.52 | | 200 day SMA | 99.98 | 100.1 | 100.23 |
|
|
