GicHousing GICHSGFIN full analysis,charts,indicators,moving averages,SMA,DMA,EMA,ADX,MACD,RSIGic Housing GICHSGFIN WideScreen charts, DMA,SMA,EMA technical analysis, forecast prediction, by indicators ADX,MACD,RSI,CCI NSE stock exchange
operates under Housing Finance sector
Daily price and charts and targets GicHousing Strong Daily Stock price targets for GicHousing GICHSGFIN are 176.73 and 181.15 | Daily Target 1 | 173.31 | | Daily Target 2 | 175.72 | | Daily Target 3 | 177.73 | | Daily Target 4 | 180.14 | | Daily Target 5 | 182.15 |
Daily price and volume Gic Housing
| Date |
Closing |
Open |
Range |
Volume |
Wed 29 October 2025 |
178.13 (1.11%) |
177.00 |
175.32 - 179.74 |
1.6203 times |
Tue 28 October 2025 |
176.18 (-0.42%) |
177.05 |
175.00 - 178.40 |
0.8958 times |
Mon 27 October 2025 |
176.93 (2.42%) |
172.55 |
172.55 - 179.39 |
2.4389 times |
Fri 24 October 2025 |
172.75 (-0.03%) |
172.90 |
171.35 - 173.85 |
0.7283 times |
Thu 23 October 2025 |
172.80 (0.34%) |
173.00 |
172.00 - 174.00 |
0.6541 times |
Tue 21 October 2025 |
172.21 (0.07%) |
172.09 |
169.02 - 173.90 |
0.3183 times |
Mon 20 October 2025 |
172.09 (0.84%) |
170.31 |
169.00 - 174.19 |
1.4007 times |
Fri 17 October 2025 |
170.66 (-0.59%) |
171.62 |
169.76 - 172.59 |
0.6588 times |
Thu 16 October 2025 |
171.68 (0.03%) |
171.05 |
170.15 - 172.90 |
0.8451 times |
Wed 15 October 2025 |
171.63 (0.36%) |
171.02 |
171.01 - 172.20 |
0.4398 times |
Tue 14 October 2025 |
171.02 (-0.75%) |
172.90 |
169.13 - 173.38 |
1.1859 times |
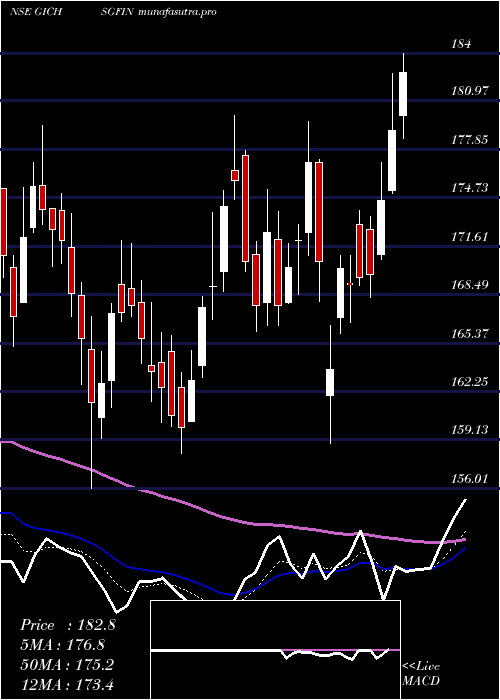
Weekly price and charts GicHousing Strong weekly Stock price targets for GicHousing GICHSGFIN are 175.34 and 182.53 | Weekly Target 1 | 169.62 | | Weekly Target 2 | 173.87 | | Weekly Target 3 | 176.80666666667 | | Weekly Target 4 | 181.06 | | Weekly Target 5 | 184 |
Weekly price and volumes for Gic Housing
| Date |
Closing |
Open |
Range |
Volume |
Wed 29 October 2025 |
178.13 (3.11%) |
172.55 |
172.55 - 179.74 |
1.086 times |
Fri 24 October 2025 |
172.75 (1.22%) |
170.31 |
169.00 - 174.19 |
0.6797 times |
Fri 17 October 2025 |
170.66 (-1.55%) |
173.00 |
169.13 - 174.87 |
0.8806 times |
Fri 10 October 2025 |
173.35 (-1.43%) |
176.00 |
172.13 - 176.28 |
0.6324 times |
Fri 03 October 2025 |
175.86 (0.38%) |
175.19 |
172.50 - 176.67 |
0.7141 times |
Fri 26 September 2025 |
175.19 (-0.42%) |
175.50 |
171.20 - 181.50 |
2.3373 times |
Fri 19 September 2025 |
175.93 (1.55%) |
173.75 |
172.25 - 178.23 |
1.4264 times |
Fri 12 September 2025 |
173.25 (0.6%) |
172.60 |
170.10 - 174.59 |
0.7816 times |
Fri 05 September 2025 |
172.21 (0.04%) |
172.14 |
170.30 - 178.30 |
0.828 times |
Fri 29 August 2025 |
172.14 (-2.51%) |
176.10 |
170.22 - 178.90 |
0.6339 times |
Fri 22 August 2025 |
176.57 (1.93%) |
173.22 |
173.22 - 183.30 |
1.3881 times |

Monthly price and charts GicHousing Strong monthly Stock price targets for GicHousing GICHSGFIN are 173.57 and 184.31 | Monthly Target 1 | 164.88 | | Monthly Target 2 | 171.51 | | Monthly Target 3 | 175.62333333333 | | Monthly Target 4 | 182.25 | | Monthly Target 5 | 186.36 |
Monthly price and volumes Gic Housing
| Date |
Closing |
Open |
Range |
Volume |
Wed 29 October 2025 |
178.13 (2.41%) |
174.45 |
169.00 - 179.74 |
0.3697 times |
Tue 30 September 2025 |
173.94 (1.05%) |
172.14 |
170.10 - 181.50 |
0.5894 times |
Fri 29 August 2025 |
172.14 (-7.96%) |
188.90 |
170.22 - 188.92 |
0.5196 times |
Thu 31 July 2025 |
187.03 (-4.75%) |
197.65 |
184.06 - 206.00 |
1.3819 times |
Mon 30 June 2025 |
196.36 (4.17%) |
188.10 |
184.19 - 201.40 |
1.1748 times |
Fri 30 May 2025 |
188.50 (7.57%) |
176.00 |
168.40 - 193.90 |
1.3928 times |
Wed 30 April 2025 |
175.23 (4.46%) |
167.99 |
158.92 - 186.69 |
1.2715 times |
Fri 28 March 2025 |
167.75 (1.24%) |
164.98 |
156.01 - 179.99 |
1.4197 times |
Fri 28 February 2025 |
165.69 (-11.2%) |
186.04 |
162.71 - 189.89 |
0.8586 times |
Fri 31 January 2025 |
186.58 (-8.69%) |
205.65 |
172.20 - 216.01 |
1.022 times |
Tue 31 December 2024 |
204.33 (-6.27%) |
218.85 |
199.21 - 229.50 |
1.5646 times |

DMA SMA EMA moving averages of Gic Housing GICHSGFIN
DMA (daily moving average) of Gic Housing GICHSGFIN
| DMA period | DMA value | | 5 day DMA | 175.36 | | 12 day DMA | 173.2 | | 20 day DMA | 173.53 | | 35 day DMA | 174.03 | | 50 day DMA | 174.31 | | 100 day DMA | 182.8 | | 150 day DMA | 181.6 | | 200 day DMA | 180.79 | EMA (exponential moving average) of Gic Housing GICHSGFIN
| EMA period | EMA current | EMA prev | EMA prev2 | | 5 day EMA | 175.82 | 174.66 | 173.9 | | 12 day EMA | 174.36 | 173.68 | 173.22 | | 20 day EMA | 174.08 | 173.65 | 173.38 | | 35 day EMA | 174.2 | 173.97 | 173.84 | | 50 day EMA | 174.73 | 174.59 | 174.53 |
SMA (simple moving average) of Gic Housing GICHSGFIN
| SMA period | SMA current | SMA prev | SMA prev2 | | 5 day SMA | 175.36 | 174.17 | 173.36 | | 12 day SMA | 173.2 | 172.8 | 172.52 | | 20 day SMA | 173.53 | 173.29 | 173.24 | | 35 day SMA | 174.03 | 173.88 | 173.77 | | 50 day SMA | 174.31 | 174.21 | 174.18 | | 100 day SMA | 182.8 | 182.93 | 183.07 | | 150 day SMA | 181.6 | 181.54 | 181.49 | | 200 day SMA | 180.79 | 180.93 | 181.05 |
|
|
