GhclTextiles GHCLTEXTIL full analysis,charts,indicators,moving averages,SMA,DMA,EMA,ADX,MACD,RSIGhcl Textiles GHCLTEXTIL WideScreen charts, DMA,SMA,EMA technical analysis, forecast prediction, by indicators ADX,MACD,RSI,CCI NSE stock exchange
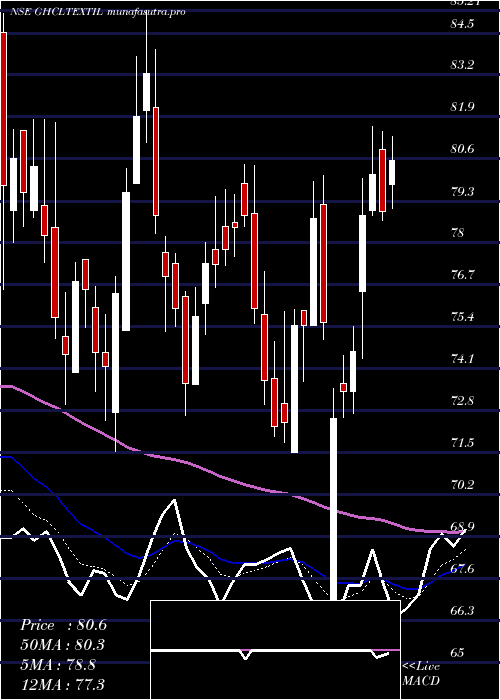
Daily price and charts and targets GhclTextiles Strong Daily Stock price targets for GhclTextiles GHCLTEXTIL are 77.37 and 78.3 | Daily Target 1 | 76.69 | | Daily Target 2 | 77.11 | | Daily Target 3 | 77.62 | | Daily Target 4 | 78.04 | | Daily Target 5 | 78.55 |
Daily price and volume Ghcl Textiles
| Date |
Closing |
Open |
Range |
Volume |
Tue 28 October 2025 |
77.53 (0.23%) |
77.49 |
77.20 - 78.13 |
0.3996 times |
Mon 27 October 2025 |
77.35 (-2.18%) |
79.70 |
76.90 - 79.70 |
1.3929 times |
Fri 24 October 2025 |
79.07 (-1.68%) |
81.50 |
78.10 - 81.69 |
1.0028 times |
Thu 23 October 2025 |
80.42 (2.77%) |
78.60 |
78.30 - 81.99 |
2.3222 times |
Tue 21 October 2025 |
78.25 (1.87%) |
77.19 |
77.19 - 78.90 |
0.1646 times |
Mon 20 October 2025 |
76.81 (0.07%) |
76.45 |
76.20 - 77.99 |
0.7592 times |
Fri 17 October 2025 |
76.76 (-1.55%) |
78.78 |
76.18 - 78.78 |
1.6278 times |
Thu 16 October 2025 |
77.97 (1.15%) |
77.08 |
77.01 - 78.85 |
0.6334 times |
Wed 15 October 2025 |
77.08 (0.94%) |
76.53 |
76.35 - 77.46 |
0.4346 times |
Tue 14 October 2025 |
76.36 (-1.78%) |
77.49 |
76.20 - 77.75 |
1.263 times |
Mon 13 October 2025 |
77.74 (1.01%) |
77.10 |
77.00 - 78.40 |
0.5936 times |
Weekly price and charts GhclTextiles Strong weekly Stock price targets for GhclTextiles GHCLTEXTIL are 75.82 and 78.62 | Weekly Target 1 | 75.24 | | Weekly Target 2 | 76.39 | | Weekly Target 3 | 78.043333333333 | | Weekly Target 4 | 79.19 | | Weekly Target 5 | 80.84 |
Weekly price and volumes for Ghcl Textiles
| Date |
Closing |
Open |
Range |
Volume |
Tue 28 October 2025 |
77.53 (-1.95%) |
79.70 |
76.90 - 79.70 |
0.4873 times |
Fri 24 October 2025 |
79.07 (3.01%) |
76.45 |
76.20 - 81.99 |
1.155 times |
Fri 17 October 2025 |
76.76 (-0.26%) |
77.10 |
76.18 - 78.85 |
1.2375 times |
Fri 10 October 2025 |
76.96 (-1.22%) |
77.90 |
76.20 - 78.68 |
0.5717 times |
Fri 03 October 2025 |
77.91 (0.71%) |
76.60 |
76.20 - 79.49 |
0.9403 times |
Fri 26 September 2025 |
77.36 (-5.21%) |
81.02 |
77.01 - 81.35 |
0.7366 times |
Fri 19 September 2025 |
81.61 (0.64%) |
81.95 |
79.01 - 83.04 |
1.0161 times |
Fri 12 September 2025 |
81.09 (5.92%) |
78.00 |
76.22 - 85.49 |
1.704 times |
Fri 05 September 2025 |
76.56 (-3.77%) |
78.75 |
76.19 - 80.99 |
0.9764 times |
Fri 29 August 2025 |
79.56 (-0.61%) |
80.66 |
76.21 - 81.87 |
1.1753 times |
Fri 22 August 2025 |
80.05 (3.61%) |
78.89 |
78.00 - 83.90 |
1.8104 times |
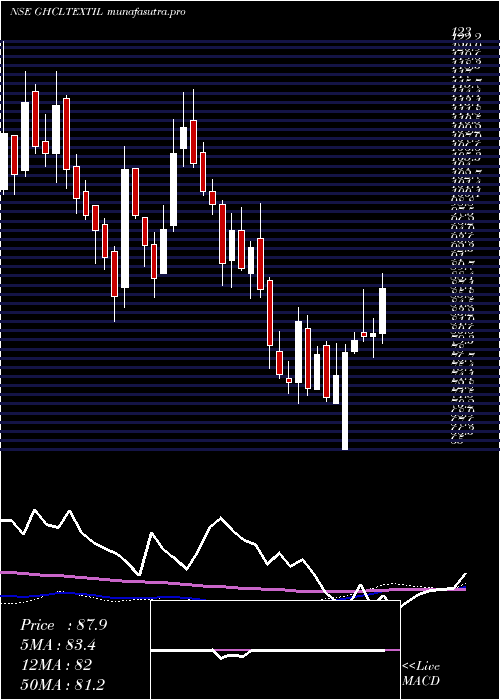
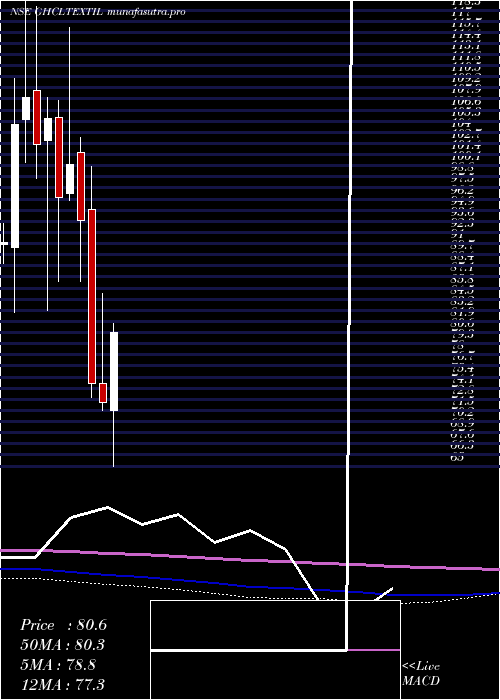
Monthly price and charts GhclTextiles Strong monthly Stock price targets for GhclTextiles GHCLTEXTIL are 76.86 and 82.67 | Monthly Target 1 | 72.76 | | Monthly Target 2 | 75.14 | | Monthly Target 3 | 78.566666666667 | | Monthly Target 4 | 80.95 | | Monthly Target 5 | 84.38 |
Monthly price and volumes Ghcl Textiles
| Date |
Closing |
Open |
Range |
Volume |
Tue 28 October 2025 |
77.53 (1.17%) |
76.30 |
76.18 - 81.99 |
0.4376 times |
Tue 30 September 2025 |
76.63 (-3.68%) |
78.75 |
76.19 - 85.49 |
0.5621 times |
Fri 29 August 2025 |
79.56 (-9.57%) |
87.90 |
76.16 - 88.55 |
0.6459 times |
Thu 31 July 2025 |
87.98 (-8.29%) |
96.07 |
87.00 - 97.70 |
0.9133 times |
Mon 30 June 2025 |
95.93 (4.41%) |
94.80 |
88.72 - 99.00 |
1.0673 times |
Fri 30 May 2025 |
91.88 (15.83%) |
78.11 |
78.11 - 95.00 |
1.7138 times |
Wed 30 April 2025 |
79.32 (9.51%) |
71.52 |
65.00 - 87.80 |
0.8024 times |
Fri 28 March 2025 |
72.43 (-2.9%) |
74.60 |
71.53 - 85.21 |
1.0863 times |
Fri 28 February 2025 |
74.59 (-20.39%) |
95.00 |
72.99 - 100.00 |
1.3441 times |
Fri 31 January 2025 |
93.70 (-6.48%) |
101.70 |
86.51 - 103.39 |
1.4273 times |
Tue 31 December 2024 |
100.19 (4%) |
96.85 |
96.00 - 116.25 |
2.4854 times |
DMA SMA EMA moving averages of Ghcl Textiles GHCLTEXTIL
DMA (daily moving average) of Ghcl Textiles GHCLTEXTIL
| DMA period | DMA value | | 5 day DMA | 78.52 | | 12 day DMA | 77.69 | | 20 day DMA | 77.46 | | 35 day DMA | 78.57 | | 50 day DMA | 78.78 | | 100 day DMA | 84.71 | | 150 day DMA | 84.44 | | 200 day DMA | 84.63 | EMA (exponential moving average) of Ghcl Textiles GHCLTEXTIL
| EMA period | EMA current | EMA prev | EMA prev2 | | 5 day EMA | 77.98 | 78.21 | 78.64 | | 12 day EMA | 77.88 | 77.94 | 78.05 | | 20 day EMA | 77.96 | 78 | 78.07 | | 35 day EMA | 78.24 | 78.28 | 78.33 | | 50 day EMA | 78.78 | 78.83 | 78.89 |
SMA (simple moving average) of Ghcl Textiles GHCLTEXTIL
| SMA period | SMA current | SMA prev | SMA prev2 | | 5 day SMA | 78.52 | 78.38 | 78.26 | | 12 day SMA | 77.69 | 77.61 | 77.56 | | 20 day SMA | 77.46 | 77.45 | 77.49 | | 35 day SMA | 78.57 | 78.54 | 78.53 | | 50 day SMA | 78.78 | 78.79 | 78.81 | | 100 day SMA | 84.71 | 84.86 | 85.01 | | 150 day SMA | 84.44 | 84.44 | 84.44 | | 200 day SMA | 84.63 | 84.71 | 84.82 |
|
|
