Ghcl GHCL full analysis,charts,indicators,moving averages,SMA,DMA,EMA,ADX,MACD,RSIGhcl GHCL WideScreen charts, DMA,SMA,EMA technical analysis, forecast prediction, by indicators ADX,MACD,RSI,CCI NSE stock exchange
operates under Commodity Chemicals sector
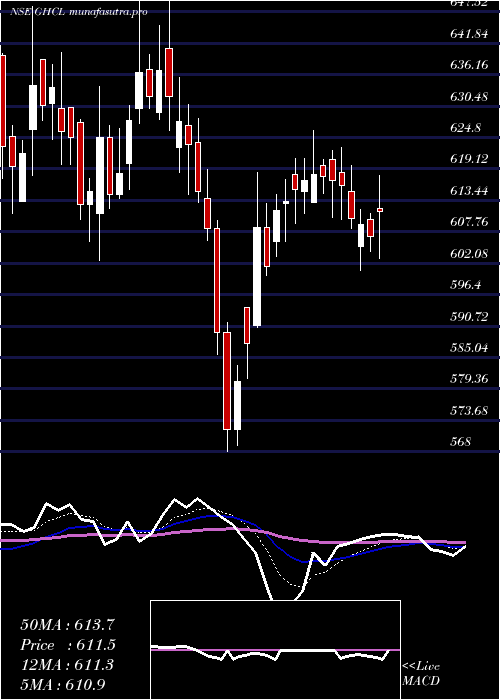
Daily price and charts and targets Ghcl Strong Daily Stock price targets for Ghcl GHCL are 635.58 and 642.38 | Daily Target 1 | 630.35 | | Daily Target 2 | 634 | | Daily Target 3 | 637.15 | | Daily Target 4 | 640.8 | | Daily Target 5 | 643.95 |
Daily price and volume Ghcl
| Date |
Closing |
Open |
Range |
Volume |
Tue 28 October 2025 |
637.65 (0.58%) |
635.00 |
633.50 - 640.30 |
0.424 times |
Mon 27 October 2025 |
633.95 (-2.48%) |
655.00 |
632.00 - 657.00 |
1.2728 times |
Fri 24 October 2025 |
650.10 (0.15%) |
645.60 |
644.00 - 651.65 |
0.4936 times |
Thu 23 October 2025 |
649.10 (-1.13%) |
658.30 |
646.65 - 659.75 |
0.8585 times |
Tue 21 October 2025 |
656.55 (1.16%) |
658.00 |
651.15 - 665.00 |
0.4435 times |
Mon 20 October 2025 |
649.00 (3.7%) |
629.70 |
625.85 - 661.95 |
3.4578 times |
Fri 17 October 2025 |
625.85 (0.06%) |
627.95 |
616.40 - 628.30 |
0.5527 times |
Thu 16 October 2025 |
625.45 (0.14%) |
624.60 |
619.30 - 639.00 |
0.8546 times |
Wed 15 October 2025 |
624.60 (-0.32%) |
625.40 |
615.45 - 629.40 |
0.6416 times |
Tue 14 October 2025 |
626.60 (-0.29%) |
626.05 |
618.15 - 630.25 |
1.0008 times |
Mon 13 October 2025 |
628.45 (-0.48%) |
622.50 |
619.30 - 629.85 |
0.4966 times |
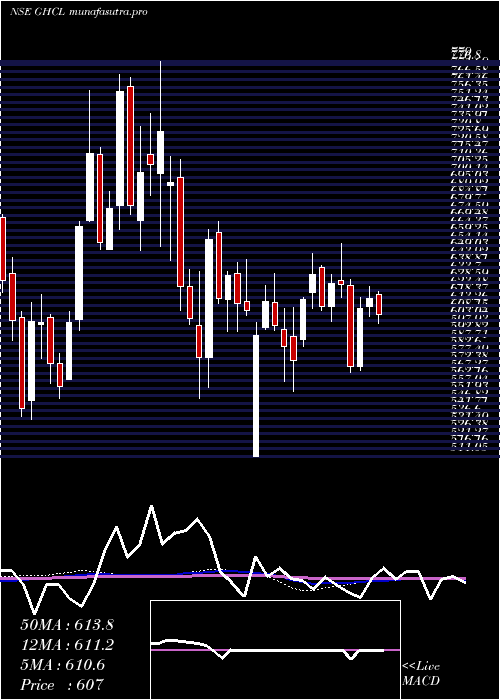
Weekly price and charts Ghcl Strong weekly Stock price targets for Ghcl GHCL are 622.33 and 647.33 | Weekly Target 1 | 617.22 | | Weekly Target 2 | 627.43 | | Weekly Target 3 | 642.21666666667 | | Weekly Target 4 | 652.43 | | Weekly Target 5 | 667.22 |
Weekly price and volumes for Ghcl
| Date |
Closing |
Open |
Range |
Volume |
Tue 28 October 2025 |
637.65 (-1.92%) |
655.00 |
632.00 - 657.00 |
0.5027 times |
Fri 24 October 2025 |
650.10 (3.87%) |
629.70 |
625.85 - 665.00 |
1.5565 times |
Fri 17 October 2025 |
625.85 (-0.89%) |
622.50 |
615.45 - 639.00 |
1.0507 times |
Fri 10 October 2025 |
631.50 (4.36%) |
609.00 |
600.00 - 645.25 |
1.5552 times |
Fri 03 October 2025 |
605.10 (3.92%) |
587.30 |
577.95 - 625.00 |
1.5027 times |
Fri 26 September 2025 |
582.30 (-0.6%) |
585.00 |
580.00 - 605.80 |
1.3646 times |
Fri 19 September 2025 |
585.80 (5.41%) |
556.00 |
556.00 - 592.55 |
0.822 times |
Fri 12 September 2025 |
555.75 (-0.13%) |
557.90 |
540.00 - 564.00 |
0.6736 times |
Fri 05 September 2025 |
556.50 (0.82%) |
550.05 |
550.05 - 572.50 |
0.5234 times |
Fri 29 August 2025 |
552.00 (-3.67%) |
572.40 |
549.00 - 581.40 |
0.4487 times |
Fri 22 August 2025 |
573.05 (3%) |
559.60 |
552.75 - 589.70 |
0.7079 times |
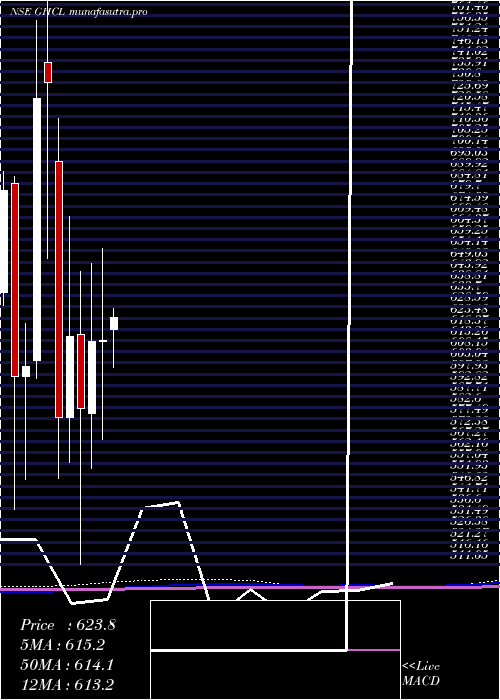
Monthly price and charts Ghcl Strong monthly Stock price targets for Ghcl GHCL are 616.9 and 685.75 | Monthly Target 1 | 564.08 | | Monthly Target 2 | 600.87 | | Monthly Target 3 | 632.93333333333 | | Monthly Target 4 | 669.72 | | Monthly Target 5 | 701.78 |
Monthly price and volumes Ghcl
| Date |
Closing |
Open |
Range |
Volume |
Tue 28 October 2025 |
637.65 (5.41%) |
605.60 |
596.15 - 665.00 |
0.873 times |
Tue 30 September 2025 |
604.95 (9.59%) |
550.05 |
540.00 - 611.00 |
0.6505 times |
Fri 29 August 2025 |
552.00 (-7.51%) |
596.80 |
541.95 - 605.50 |
0.4563 times |
Thu 31 July 2025 |
596.80 (-2.68%) |
618.10 |
583.50 - 635.00 |
0.9082 times |
Mon 30 June 2025 |
613.25 (0.09%) |
612.70 |
568.00 - 655.00 |
1.0395 times |
Fri 30 May 2025 |
612.70 (5.2%) |
580.00 |
555.00 - 648.50 |
0.8601 times |
Wed 30 April 2025 |
582.40 (-5.28%) |
615.90 |
511.05 - 644.65 |
0.7282 times |
Fri 28 March 2025 |
614.85 (6.38%) |
578.00 |
557.60 - 670.00 |
0.9653 times |
Fri 28 February 2025 |
578.00 (-20.94%) |
694.85 |
550.45 - 714.60 |
1.1053 times |
Fri 31 January 2025 |
731.05 (1.04%) |
740.00 |
650.50 - 779.00 |
2.4136 times |
Tue 31 December 2024 |
723.50 (20.26%) |
604.00 |
596.00 - 759.40 |
3.4719 times |
DMA SMA EMA moving averages of Ghcl GHCL
DMA (daily moving average) of Ghcl GHCL
| DMA period | DMA value | | 5 day DMA | 645.47 | | 12 day DMA | 636.57 | | 20 day DMA | 625.8 | | 35 day DMA | 603.64 | | 50 day DMA | 592.4 | | 100 day DMA | 598.13 | | 150 day DMA | 602.59 | | 200 day DMA | 617.18 | EMA (exponential moving average) of Ghcl GHCL
| EMA period | EMA current | EMA prev | EMA prev2 | | 5 day EMA | 640.47 | 641.88 | 645.85 | | 12 day EMA | 635.01 | 634.53 | 634.63 | | 20 day EMA | 625.93 | 624.7 | 623.73 | | 35 day EMA | 610.75 | 609.17 | 607.71 | | 50 day EMA | 594.75 | 593 | 591.33 |
SMA (simple moving average) of Ghcl GHCL
| SMA period | SMA current | SMA prev | SMA prev2 | | 5 day SMA | 645.47 | 647.74 | 646.12 | | 12 day SMA | 636.57 | 636.23 | 635.12 | | 20 day SMA | 625.8 | 623.03 | 621.25 | | 35 day SMA | 603.64 | 601.32 | 599.27 | | 50 day SMA | 592.4 | 591.04 | 589.66 | | 100 day SMA | 598.13 | 597.9 | 597.81 | | 150 day SMA | 602.59 | 602.49 | 602.35 | | 200 day SMA | 617.18 | 617.68 | 618.3 |
|
|
