Gfl GFLLIMITED full analysis,charts,indicators,moving averages,SMA,DMA,EMA,ADX,MACD,RSIGfl GFLLIMITED WideScreen charts, DMA,SMA,EMA technical analysis, forecast prediction, by indicators ADX,MACD,RSI,CCI NSE stock exchange
Daily price and charts and targets Gfl Strong Daily Stock price targets for Gfl GFLLIMITED are 65.54 and 72.43 | Daily Target 1 | 64.24 | | Daily Target 2 | 66.84 | | Daily Target 3 | 71.126666666667 | | Daily Target 4 | 73.73 | | Daily Target 5 | 78.02 |
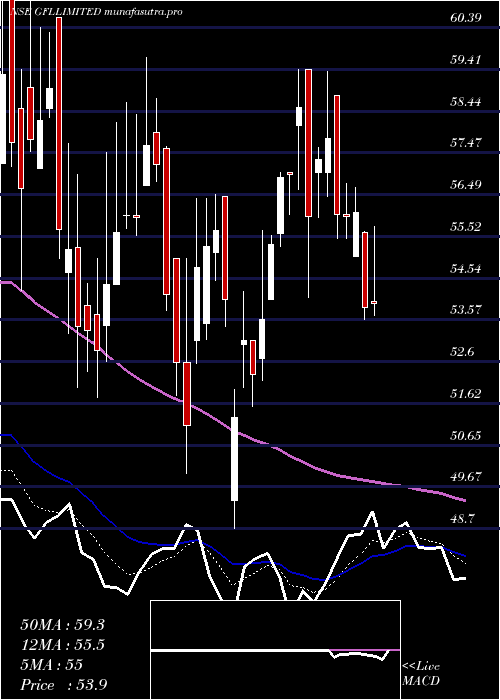
Daily price and volume Gfl
| Date |
Closing |
Open |
Range |
Volume |
Tue 28 October 2025 |
69.45 (-6.75%) |
74.50 |
68.52 - 75.41 |
0.5137 times |
Mon 27 October 2025 |
74.48 (1.64%) |
74.00 |
73.32 - 75.50 |
0.4334 times |
Fri 24 October 2025 |
73.28 (-1.98%) |
75.90 |
72.50 - 75.91 |
0.4089 times |
Thu 23 October 2025 |
74.76 (-3.07%) |
78.00 |
73.99 - 78.80 |
0.9406 times |
Tue 21 October 2025 |
77.13 (9.23%) |
72.17 |
72.17 - 81.00 |
1.5555 times |
Mon 20 October 2025 |
70.61 (10.6%) |
65.80 |
63.92 - 74.40 |
2.2659 times |
Fri 17 October 2025 |
63.84 (5.54%) |
68.00 |
63.10 - 72.58 |
3.6729 times |
Thu 16 October 2025 |
60.49 (1.84%) |
60.55 |
59.72 - 62.99 |
0.0977 times |
Wed 15 October 2025 |
59.40 (0.61%) |
58.50 |
58.26 - 60.62 |
0.0508 times |
Tue 14 October 2025 |
59.04 (-1.98%) |
60.00 |
58.40 - 61.07 |
0.0606 times |
Mon 13 October 2025 |
60.23 (-1.02%) |
61.93 |
59.96 - 61.93 |
0.0402 times |
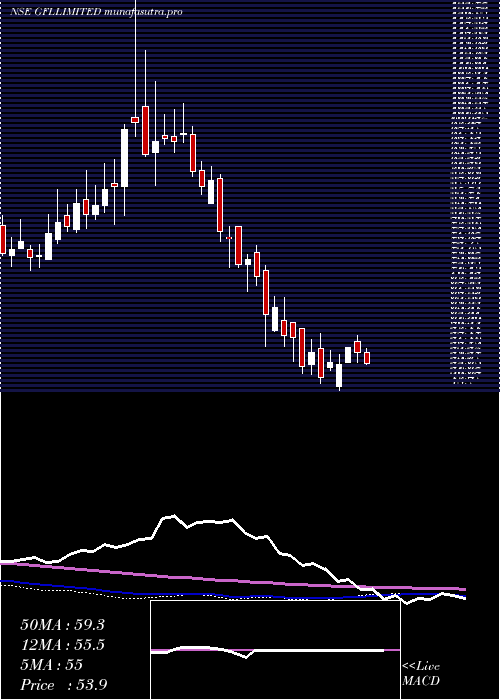
Weekly price and charts Gfl Strong weekly Stock price targets for Gfl GFLLIMITED are 65.5 and 72.48 | Weekly Target 1 | 64.18 | | Weekly Target 2 | 66.81 | | Weekly Target 3 | 71.156666666667 | | Weekly Target 4 | 73.79 | | Weekly Target 5 | 78.14 |
Weekly price and volumes for Gfl
| Date |
Closing |
Open |
Range |
Volume |
Tue 28 October 2025 |
69.45 (-5.23%) |
74.00 |
68.52 - 75.50 |
0.7789 times |
Fri 24 October 2025 |
73.28 (14.79%) |
65.80 |
63.92 - 81.00 |
4.2523 times |
Fri 17 October 2025 |
63.84 (4.91%) |
61.93 |
58.26 - 72.58 |
3.2253 times |
Fri 10 October 2025 |
60.85 (-2.42%) |
62.59 |
59.10 - 63.25 |
0.1788 times |
Fri 03 October 2025 |
62.36 (1.9%) |
61.20 |
60.25 - 64.69 |
0.1597 times |
Fri 26 September 2025 |
61.20 (1.34%) |
60.39 |
60.39 - 68.76 |
0.448 times |
Fri 19 September 2025 |
60.39 (-0.74%) |
60.21 |
60.00 - 62.79 |
0.3322 times |
Fri 12 September 2025 |
60.84 (1.69%) |
61.03 |
58.50 - 62.65 |
0.2196 times |
Fri 05 September 2025 |
59.83 (0.52%) |
61.00 |
59.30 - 62.80 |
0.2489 times |
Fri 29 August 2025 |
59.52 (-3.7%) |
61.75 |
58.90 - 62.25 |
0.1563 times |
Fri 22 August 2025 |
61.81 (2.23%) |
61.25 |
60.11 - 63.85 |
0.2489 times |
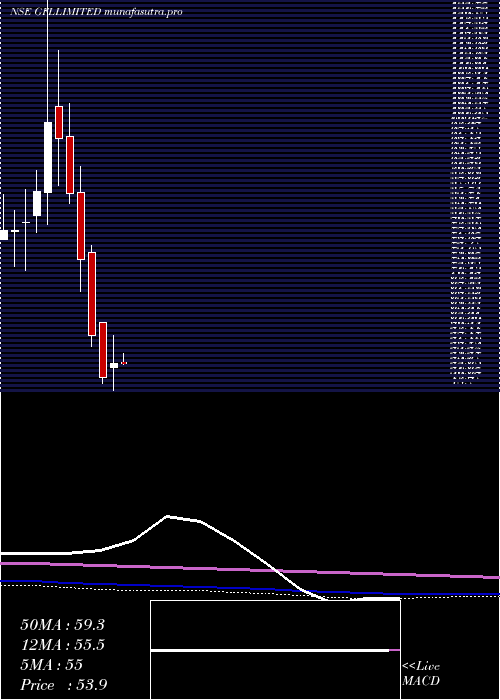
Monthly price and charts Gfl Strong monthly Stock price targets for Gfl GFLLIMITED are 63.86 and 86.6 | Monthly Target 1 | 46.83 | | Monthly Target 2 | 58.14 | | Monthly Target 3 | 69.57 | | Monthly Target 4 | 80.88 | | Monthly Target 5 | 92.31 |
Monthly price and volumes Gfl
| Date |
Closing |
Open |
Range |
Volume |
Tue 28 October 2025 |
69.45 (13.65%) |
61.11 |
58.26 - 81.00 |
3.2915 times |
Tue 30 September 2025 |
61.11 (2.67%) |
61.00 |
58.50 - 68.76 |
0.5046 times |
Fri 29 August 2025 |
59.52 (-2.68%) |
61.29 |
58.90 - 65.75 |
0.3072 times |
Thu 31 July 2025 |
61.16 (-7.86%) |
66.38 |
58.95 - 69.77 |
0.5804 times |
Mon 30 June 2025 |
66.38 (1.1%) |
66.00 |
59.31 - 72.00 |
0.9162 times |
Fri 30 May 2025 |
65.66 (21.89%) |
54.01 |
51.95 - 71.40 |
1.0919 times |
Wed 30 April 2025 |
53.87 (5.42%) |
53.09 |
48.70 - 59.42 |
0.6397 times |
Fri 28 March 2025 |
51.10 (-13.83%) |
61.95 |
50.00 - 61.95 |
1.3918 times |
Fri 28 February 2025 |
59.30 (-20.04%) |
75.49 |
57.15 - 76.97 |
0.5556 times |
Fri 31 January 2025 |
74.16 (-14.73%) |
87.25 |
67.85 - 92.28 |
0.7211 times |
Tue 31 December 2024 |
86.97 (-10.96%) |
98.14 |
85.06 - 104.60 |
1.396 times |
DMA SMA EMA moving averages of Gfl GFLLIMITED
DMA (daily moving average) of Gfl GFLLIMITED
| DMA period | DMA value | | 5 day DMA | 73.82 | | 12 day DMA | 66.96 | | 20 day DMA | 64.69 | | 35 day DMA | 63.16 | | 50 day DMA | 62.44 | | 100 day DMA | 63.11 | | 150 day DMA | 60.77 | | 200 day DMA | 62.55 | EMA (exponential moving average) of Gfl GFLLIMITED
| EMA period | EMA current | EMA prev | EMA prev2 | | 5 day EMA | 71.5 | 72.53 | 71.56 | | 12 day EMA | 68.61 | 68.46 | 67.37 | | 20 day EMA | 66.5 | 66.19 | 65.32 | | 35 day EMA | 64.57 | 64.28 | 63.68 | | 50 day EMA | 63.51 | 63.27 | 62.81 |
SMA (simple moving average) of Gfl GFLLIMITED
| SMA period | SMA current | SMA prev | SMA prev2 | | 5 day SMA | 73.82 | 74.05 | 71.92 | | 12 day SMA | 66.96 | 66.24 | 65.14 | | 20 day SMA | 64.69 | 64.28 | 63.68 | | 35 day SMA | 63.16 | 62.89 | 62.47 | | 50 day SMA | 62.44 | 62.28 | 62.03 | | 100 day SMA | 63.11 | 63.05 | 62.92 | | 150 day SMA | 60.77 | 60.68 | 60.54 | | 200 day SMA | 62.55 | 62.62 | 62.69 |
|
|
