GemAromatics GEMAROMA full analysis,charts,indicators,moving averages,SMA,DMA,EMA,ADX,MACD,RSIGem Aromatics GEMAROMA WideScreen charts, DMA,SMA,EMA technical analysis, forecast prediction, by indicators ADX,MACD,RSI,CCI NSE stock exchange
Daily price and charts and targets GemAromatics Strong Daily Stock price targets for GemAromatics GEMAROMA are 229.58 and 241.58 | Daily Target 1 | 220.05 | | Daily Target 2 | 227.11 | | Daily Target 3 | 232.05333333333 | | Daily Target 4 | 239.11 | | Daily Target 5 | 244.05 |
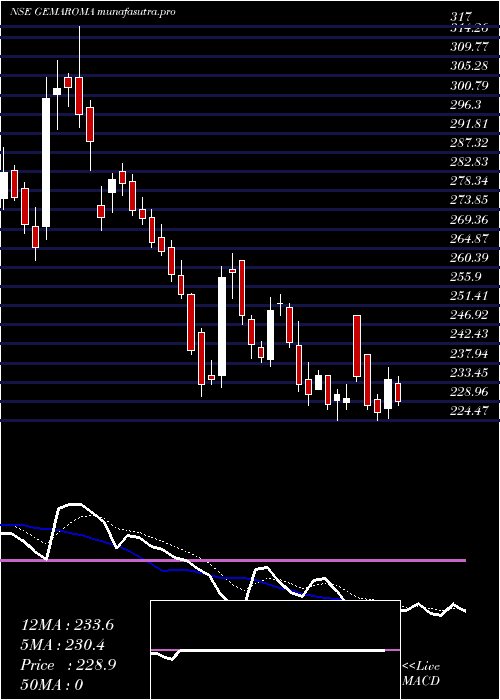
Daily price and volume Gem Aromatics
| Date |
Closing |
Open |
Range |
Volume |
Tue 28 October 2025 |
234.16 (3.47%) |
227.18 |
225.00 - 237.00 |
1.4051 times |
Mon 27 October 2025 |
226.31 (-0.69%) |
229.40 |
224.47 - 230.50 |
0.7497 times |
Fri 24 October 2025 |
227.88 (-2.89%) |
240.00 |
227.00 - 240.00 |
1.5887 times |
Thu 23 October 2025 |
234.67 (2.25%) |
249.00 |
233.65 - 249.00 |
3.5205 times |
Tue 21 October 2025 |
229.51 (-0.43%) |
228.60 |
227.00 - 232.79 |
0.2741 times |
Mon 20 October 2025 |
230.49 (1%) |
229.12 |
224.49 - 231.80 |
0.2217 times |
Fri 17 October 2025 |
228.21 (-2.9%) |
234.99 |
227.10 - 234.99 |
0.3168 times |
Thu 16 October 2025 |
235.03 (1.94%) |
231.71 |
231.65 - 236.24 |
0.4428 times |
Wed 15 October 2025 |
230.56 (-0.99%) |
234.00 |
227.95 - 238.00 |
0.7569 times |
Tue 14 October 2025 |
232.87 (-4.11%) |
242.10 |
231.20 - 247.70 |
0.7238 times |
Mon 13 October 2025 |
242.84 (-3.61%) |
251.00 |
241.56 - 251.93 |
0.2919 times |
Weekly price and charts GemAromatics Strong weekly Stock price targets for GemAromatics GEMAROMA are 229.32 and 241.85 | Weekly Target 1 | 219.35 | | Weekly Target 2 | 226.75 | | Weekly Target 3 | 231.87666666667 | | Weekly Target 4 | 239.28 | | Weekly Target 5 | 244.41 |
Weekly price and volumes for Gem Aromatics
| Date |
Closing |
Open |
Range |
Volume |
Tue 28 October 2025 |
234.16 (2.76%) |
229.40 |
224.47 - 237.00 |
0.3372 times |
Fri 24 October 2025 |
227.88 (-0.14%) |
229.12 |
224.49 - 249.00 |
0.8771 times |
Fri 17 October 2025 |
228.21 (-9.42%) |
251.00 |
227.10 - 251.93 |
0.3962 times |
Fri 10 October 2025 |
251.93 (-2.79%) |
261.90 |
237.05 - 261.90 |
0.346 times |
Fri 03 October 2025 |
259.15 (7.58%) |
245.00 |
230.10 - 263.68 |
0.7714 times |
Fri 26 September 2025 |
240.90 (-11.42%) |
272.00 |
240.00 - 274.00 |
0.629 times |
Fri 19 September 2025 |
271.95 (-6.22%) |
275.00 |
269.10 - 284.75 |
1.0537 times |
Fri 12 September 2025 |
290.00 (9.45%) |
270.00 |
266.95 - 317.00 |
2.7062 times |
Fri 05 September 2025 |
264.95 (0%) |
276.80 |
261.95 - 293.75 |
1.8832 times |
Wed 29 October 2025 |
(0%) |
|
- |
0 times |

Monthly price and charts GemAromatics Strong monthly Stock price targets for GemAromatics GEMAROMA are 209.71 and 248.92 | Monthly Target 1 | 201.56 | | Monthly Target 2 | 217.86 | | Monthly Target 3 | 240.77 | | Monthly Target 4 | 257.07 | | Monthly Target 5 | 279.98 |
Monthly price and volumes Gem Aromatics
| Date |
Closing |
Open |
Range |
Volume |
Tue 28 October 2025 |
234.16 (0.03%) |
235.00 |
224.47 - 263.68 |
0.5141 times |
Tue 30 September 2025 |
234.10 (-15.23%) |
276.80 |
230.10 - 317.00 |
1.349 times |
Fri 29 August 2025 |
276.15 (0%) |
333.10 |
273.65 - 349.60 |
1.1369 times |
Wed 29 October 2025 |
(0%) |
|
- |
0 times |

DMA SMA EMA moving averages of Gem Aromatics GEMAROMA
DMA (daily moving average) of Gem Aromatics GEMAROMA
| DMA period | DMA value | | 5 day DMA | 230.51 | | 12 day DMA | 233.71 | | 20 day DMA | 238.47 | | 35 day DMA | 254.96 | | 50 day DMA | | | 100 day DMA | | | 150 day DMA | | | 200 day DMA | | EMA (exponential moving average) of Gem Aromatics GEMAROMA
| EMA period | EMA current | EMA prev | EMA prev2 | | 5 day EMA | 231.07 | 229.52 | 231.13 | | 12 day EMA | 234.42 | 234.47 | 235.95 | | 20 day EMA | 240.34 | 240.99 | 242.53 | | 35 day EMA | 253.45 | 254.59 | 256.26 | | 50 day EMA | 0 | 0 | 0 |
SMA (simple moving average) of Gem Aromatics GEMAROMA
| SMA period | SMA current | SMA prev | SMA prev2 | | 5 day SMA | 230.51 | 229.77 | 230.15 | | 12 day SMA | 233.71 | 235.04 | 236.12 | | 20 day SMA | 238.47 | 238.81 | 240.19 | | 35 day SMA | 254.96 | 255.84 | 257.09 | | 50 day SMA | | 100 day SMA | | 150 day SMA | | 200 day SMA |
|
|
