GacmTechnologies GATECH full analysis,charts,indicators,moving averages,SMA,DMA,EMA,ADX,MACD,RSIGacm Technologies GATECH WideScreen charts, DMA,SMA,EMA technical analysis, forecast prediction, by indicators ADX,MACD,RSI,CCI NSE stock exchange
Daily price and charts and targets GacmTechnologies Strong Daily Stock price targets for GacmTechnologies GATECH are 0.56 and 0.61 | Daily Target 1 | 0.52 | | Daily Target 2 | 0.55 | | Daily Target 3 | 0.57 | | Daily Target 4 | 0.6 | | Daily Target 5 | 0.62 |
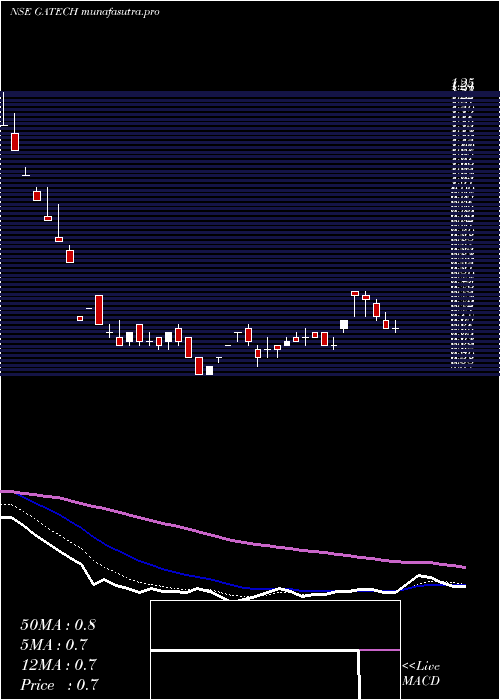
Daily price and volume Gacm Technologies
| Date |
Closing |
Open |
Range |
Volume |
Fri 05 December 2025 |
0.58 (5.45%) |
0.55 |
0.54 - 0.59 |
1.2801 times |
Thu 04 December 2025 |
0.55 (-3.51%) |
0.58 |
0.55 - 0.58 |
1.3526 times |
Wed 03 December 2025 |
0.57 (-1.72%) |
0.58 |
0.57 - 0.59 |
0.7494 times |
Tue 02 December 2025 |
0.58 (-1.69%) |
0.60 |
0.58 - 0.60 |
0.8492 times |
Mon 01 December 2025 |
0.59 (1.72%) |
0.59 |
0.58 - 0.60 |
0.9724 times |
Fri 28 November 2025 |
0.58 (-1.69%) |
0.59 |
0.57 - 0.60 |
1.365 times |
Thu 27 November 2025 |
0.59 (-1.67%) |
0.61 |
0.59 - 0.61 |
0.6101 times |
Wed 26 November 2025 |
0.60 (1.69%) |
0.59 |
0.59 - 0.61 |
1.2561 times |
Tue 25 November 2025 |
0.59 (-1.67%) |
0.61 |
0.59 - 0.61 |
0.8489 times |
Mon 24 November 2025 |
0.60 (-1.64%) |
0.61 |
0.60 - 0.62 |
0.7162 times |
Fri 21 November 2025 |
0.61 (0%) |
0.63 |
0.61 - 0.64 |
1.3018 times |
Weekly price and charts GacmTechnologies Strong weekly Stock price targets for GacmTechnologies GATECH are 0.53 and 0.59 | Weekly Target 1 | 0.51 | | Weekly Target 2 | 0.55 | | Weekly Target 3 | 0.57333333333333 | | Weekly Target 4 | 0.61 | | Weekly Target 5 | 0.63 |
Weekly price and volumes for Gacm Technologies
| Date |
Closing |
Open |
Range |
Volume |
Fri 05 December 2025 |
0.58 (0%) |
0.59 |
0.54 - 0.60 |
0.5713 times |
Fri 28 November 2025 |
0.58 (-4.92%) |
0.61 |
0.57 - 0.62 |
0.5266 times |
Fri 21 November 2025 |
0.61 (-1.61%) |
0.62 |
0.58 - 0.64 |
0.9109 times |
Fri 14 November 2025 |
0.62 (1.64%) |
0.61 |
0.61 - 0.67 |
0.9709 times |
Fri 07 November 2025 |
0.61 (-4.69%) |
0.66 |
0.59 - 0.66 |
0.8191 times |
Fri 31 October 2025 |
0.64 (-4.48%) |
0.68 |
0.62 - 0.68 |
1.4147 times |
Fri 24 October 2025 |
0.67 (-1.47%) |
0.70 |
0.66 - 0.70 |
0.45 times |
Fri 17 October 2025 |
0.68 (-2.86%) |
0.70 |
0.66 - 0.73 |
1.6628 times |
Fri 10 October 2025 |
0.70 (4.48%) |
0.70 |
0.68 - 0.79 |
1.3148 times |
Fri 03 October 2025 |
0.67 (-10.67%) |
0.71 |
0.63 - 0.71 |
1.3587 times |
Fri 26 September 2025 |
0.75 (1.35%) |
0.77 |
0.75 - 0.93 |
3.036 times |

Monthly price and charts GacmTechnologies Strong monthly Stock price targets for GacmTechnologies GATECH are 0.53 and 0.59 | Monthly Target 1 | 0.51 | | Monthly Target 2 | 0.55 | | Monthly Target 3 | 0.57333333333333 | | Monthly Target 4 | 0.61 | | Monthly Target 5 | 0.63 |
Monthly price and volumes Gacm Technologies
| Date |
Closing |
Open |
Range |
Volume |
Fri 05 December 2025 |
0.58 (0%) |
0.59 |
0.54 - 0.60 |
0.1255 times |
Fri 28 November 2025 |
0.58 (-9.38%) |
0.66 |
0.57 - 0.67 |
0.7091 times |
Fri 31 October 2025 |
0.64 (-4.48%) |
0.63 |
0.62 - 0.79 |
1.266 times |
Tue 30 September 2025 |
0.67 (-34.95%) |
0.65 |
0.65 - 0.93 |
1.1563 times |
Wed 11 June 2025 |
1.03 (32.05%) |
0.81 |
0.81 - 1.21 |
0.6518 times |
Fri 30 May 2025 |
0.78 (14.71%) |
0.69 |
0.66 - 0.92 |
0.5513 times |
Wed 30 April 2025 |
0.68 (15.25%) |
0.61 |
0.59 - 0.77 |
0.4557 times |
Fri 28 March 2025 |
0.59 (-29.76%) |
0.71 |
0.57 - 0.76 |
0.2607 times |
Mon 30 September 2024 |
0.84 (-44.74%) |
1.44 |
0.84 - 1.79 |
4.3133 times |
Fri 30 August 2024 |
1.52 (22.58%) |
1.30 |
1.13 - 1.52 |
0.5104 times |
Wed 31 July 2024 |
1.24 (-24.85%) |
1.38 |
1.19 - 1.38 |
0.0886 times |

DMA SMA EMA moving averages of Gacm Technologies GATECH
DMA (daily moving average) of Gacm Technologies GATECH
| DMA period | DMA value | | 5 day DMA | 0.57 | | 12 day DMA | 0.59 | | 20 day DMA | 0.6 | | 35 day DMA | 0.62 | | 50 day DMA | 0.65 | | 100 day DMA | 0.71 | | 150 day DMA | 0.83 | | 200 day DMA | | EMA (exponential moving average) of Gacm Technologies GATECH
| EMA period | EMA current | EMA prev | EMA prev2 | | 5 day EMA | 0.57 | 0.57 | 0.58 | | 12 day EMA | 0.59 | 0.59 | 0.6 | | 20 day EMA | 0.61 | 0.61 | 0.62 | | 35 day EMA | 0.64 | 0.64 | 0.65 | | 50 day EMA | 0.67 | 0.67 | 0.67 |
SMA (simple moving average) of Gacm Technologies GATECH
| SMA period | SMA current | SMA prev | SMA prev2 | | 5 day SMA | 0.57 | 0.57 | 0.58 | | 12 day SMA | 0.59 | 0.59 | 0.59 | | 20 day SMA | 0.6 | 0.6 | 0.61 | | 35 day SMA | 0.62 | 0.63 | 0.63 | | 50 day SMA | 0.65 | 0.66 | 0.66 | | 100 day SMA | 0.71 | 0.71 | 0.71 | | 150 day SMA | 0.83 | 0.83 | 0.84 | | 200 day SMA |
|
|
