GarudaConstruct GARUDA full analysis,charts,indicators,moving averages,SMA,DMA,EMA,ADX,MACD,RSIGaruda Construct GARUDA WideScreen charts, DMA,SMA,EMA technical analysis, forecast prediction, by indicators ADX,MACD,RSI,CCI NSE stock exchange
Daily price and charts and targets GarudaConstruct Strong Daily Stock price targets for GarudaConstruct GARUDA are 196.99 and 207.99 | Daily Target 1 | 193.99 | | Daily Target 2 | 199.98 | | Daily Target 3 | 204.99 | | Daily Target 4 | 210.98 | | Daily Target 5 | 215.99 |
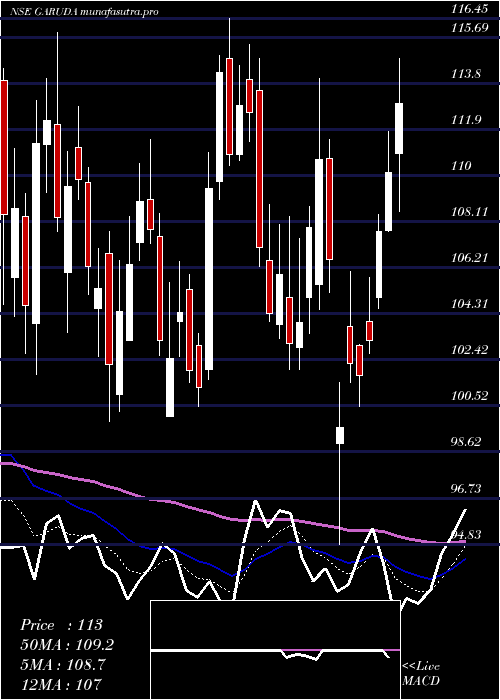
Daily price and volume Garuda Construct
| Date |
Closing |
Open |
Range |
Volume |
Tue 28 October 2025 |
205.97 (-0.89%) |
209.88 |
199.00 - 210.00 |
0.8181 times |
Mon 27 October 2025 |
207.81 (-4.64%) |
220.89 |
204.31 - 230.70 |
4.5219 times |
Fri 24 October 2025 |
217.92 (2.45%) |
214.50 |
209.40 - 219.34 |
0.705 times |
Thu 23 October 2025 |
212.71 (5.84%) |
203.85 |
201.50 - 220.00 |
2.3801 times |
Tue 21 October 2025 |
200.97 (2.26%) |
198.10 |
198.00 - 202.40 |
0.221 times |
Mon 20 October 2025 |
196.52 (5.49%) |
187.35 |
185.72 - 198.45 |
0.5116 times |
Fri 17 October 2025 |
186.30 (-0.99%) |
188.15 |
183.93 - 190.00 |
0.1936 times |
Thu 16 October 2025 |
188.16 (-0.77%) |
190.15 |
187.20 - 192.50 |
0.1628 times |
Wed 15 October 2025 |
189.62 (0.16%) |
191.00 |
188.37 - 191.51 |
0.1444 times |
Tue 14 October 2025 |
189.31 (-3.73%) |
196.71 |
186.45 - 197.29 |
0.3415 times |
Mon 13 October 2025 |
196.64 (-1.36%) |
198.40 |
194.40 - 198.40 |
0.2302 times |
Weekly price and charts GarudaConstruct Strong weekly Stock price targets for GarudaConstruct GARUDA are 186.64 and 218.34 | Weekly Target 1 | 180.19 | | Weekly Target 2 | 193.08 | | Weekly Target 3 | 211.89 | | Weekly Target 4 | 224.78 | | Weekly Target 5 | 243.59 |
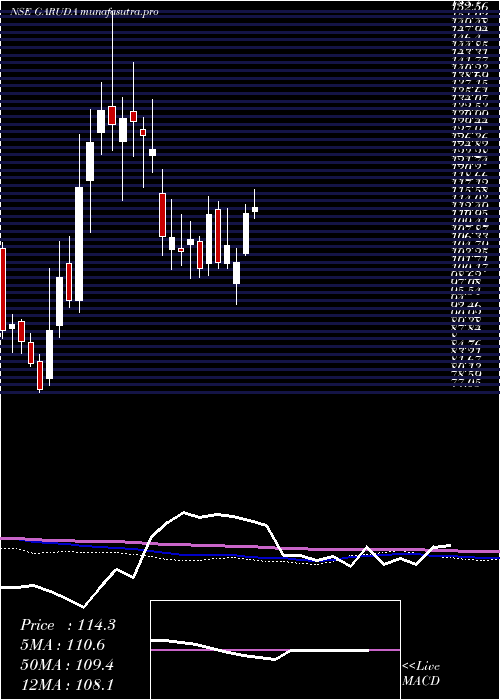
Weekly price and volumes for Garuda Construct
| Date |
Closing |
Open |
Range |
Volume |
Tue 28 October 2025 |
205.97 (-5.48%) |
220.89 |
199.00 - 230.70 |
1.4468 times |
Fri 24 October 2025 |
217.92 (16.97%) |
187.35 |
185.72 - 220.00 |
1.0343 times |
Fri 17 October 2025 |
186.30 (-6.55%) |
198.40 |
183.93 - 198.40 |
0.2906 times |
Fri 10 October 2025 |
199.35 (5.04%) |
190.52 |
182.05 - 209.25 |
1.9937 times |
Fri 03 October 2025 |
189.79 (1.31%) |
185.10 |
176.55 - 193.00 |
0.3479 times |
Fri 26 September 2025 |
187.33 (-8.33%) |
203.72 |
183.19 - 204.39 |
0.4159 times |
Fri 19 September 2025 |
204.35 (0.42%) |
205.00 |
202.18 - 213.40 |
0.3773 times |
Fri 12 September 2025 |
203.49 (0.37%) |
204.00 |
196.60 - 220.00 |
0.8671 times |
Fri 05 September 2025 |
202.74 (-6.28%) |
218.00 |
199.00 - 229.99 |
1.3131 times |
Fri 29 August 2025 |
216.33 (12.53%) |
194.80 |
194.80 - 223.90 |
1.9134 times |
Fri 22 August 2025 |
192.25 (9.76%) |
178.28 |
178.28 - 204.94 |
0.9874 times |
Monthly price and charts GarudaConstruct Strong monthly Stock price targets for GarudaConstruct GARUDA are 194.01 and 242.66 | Monthly Target 1 | 157.59 | | Monthly Target 2 | 181.78 | | Monthly Target 3 | 206.24 | | Monthly Target 4 | 230.43 | | Monthly Target 5 | 254.89 |
Monthly price and volumes Garuda Construct
| Date |
Closing |
Open |
Range |
Volume |
Tue 28 October 2025 |
205.97 (11.46%) |
184.99 |
182.05 - 230.70 |
1.1201 times |
Tue 30 September 2025 |
184.80 (-14.57%) |
218.00 |
176.55 - 229.99 |
0.7323 times |
Fri 29 August 2025 |
216.33 (16.39%) |
186.00 |
168.02 - 223.90 |
0.983 times |
Thu 31 July 2025 |
185.86 (52.05%) |
122.77 |
119.10 - 205.89 |
3.7104 times |
Mon 30 June 2025 |
122.24 (6.71%) |
116.00 |
108.10 - 131.50 |
0.6822 times |
Fri 30 May 2025 |
114.55 (15.52%) |
99.60 |
87.50 - 118.00 |
0.3358 times |
Wed 30 April 2025 |
99.16 (-3.82%) |
102.94 |
94.83 - 117.90 |
0.2138 times |
Fri 28 March 2025 |
103.10 (-2.14%) |
106.80 |
99.90 - 116.45 |
0.2128 times |
Fri 28 February 2025 |
105.35 (-18.1%) |
124.80 |
101.81 - 135.87 |
0.447 times |
Fri 31 January 2025 |
128.64 (-3.61%) |
133.50 |
115.65 - 153.70 |
1.5626 times |
Tue 31 December 2024 |
133.46 (49.17%) |
90.49 |
88.03 - 139.40 |
2.1214 times |

DMA SMA EMA moving averages of Garuda Construct GARUDA
DMA (daily moving average) of Garuda Construct GARUDA
| DMA period | DMA value | | 5 day DMA | 209.08 | | 12 day DMA | 199.27 | | 20 day DMA | 194.78 | | 35 day DMA | 197.98 | | 50 day DMA | 198.99 | | 100 day DMA | 172.7 | | 150 day DMA | 150.12 | | 200 day DMA | 142.27 | EMA (exponential moving average) of Garuda Construct GARUDA
| EMA period | EMA current | EMA prev | EMA prev2 | | 5 day EMA | 206.6 | 206.91 | 206.46 | | 12 day EMA | 201.6 | 200.8 | 199.52 | | 20 day EMA | 199.08 | 198.36 | 197.37 | | 35 day EMA | 197.44 | 196.94 | 196.3 | | 50 day EMA | 197.91 | 197.58 | 197.16 |
SMA (simple moving average) of Garuda Construct GARUDA
| SMA period | SMA current | SMA prev | SMA prev2 | | 5 day SMA | 209.08 | 207.19 | 202.88 | | 12 day SMA | 199.27 | 198.48 | 196.85 | | 20 day SMA | 194.78 | 193.85 | 193.26 | | 35 day SMA | 197.98 | 197.88 | 197.87 | | 50 day SMA | 198.99 | 198.51 | 197.78 | | 100 day SMA | 172.7 | 171.75 | 170.75 | | 150 day SMA | 150.12 | 149.51 | 148.85 | | 200 day SMA | 142.27 | 141.88 | 141.51 |
|
|
