GarwareTech GARFIBRES full analysis,charts,indicators,moving averages,SMA,DMA,EMA,ADX,MACD,RSIGarware Tech GARFIBRES WideScreen charts, DMA,SMA,EMA technical analysis, forecast prediction, by indicators ADX,MACD,RSI,CCI NSE stock exchange
Daily price and charts and targets GarwareTech Strong Daily Stock price targets for GarwareTech GARFIBRES are 762.43 and 776.33 | Daily Target 1 | 759.37 | | Daily Target 2 | 765.48 | | Daily Target 3 | 773.26666666667 | | Daily Target 4 | 779.38 | | Daily Target 5 | 787.17 |
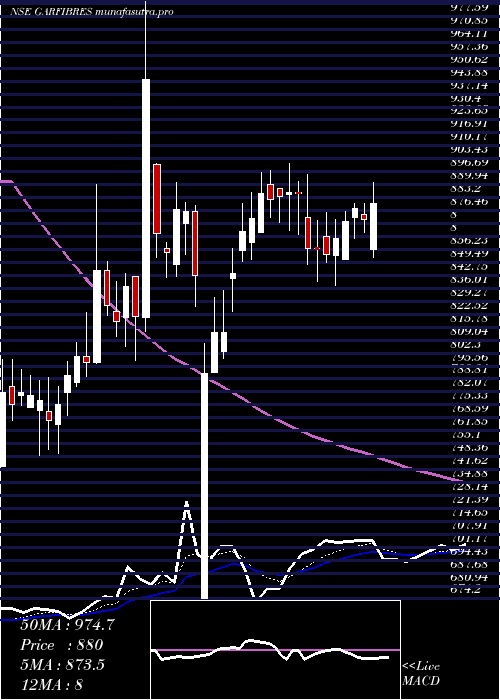
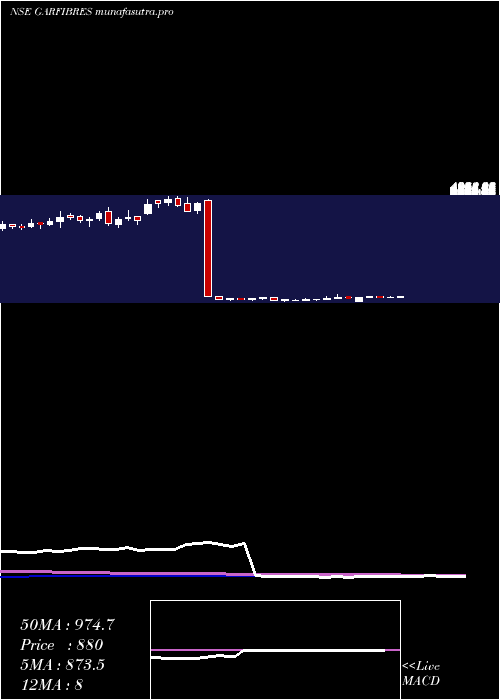
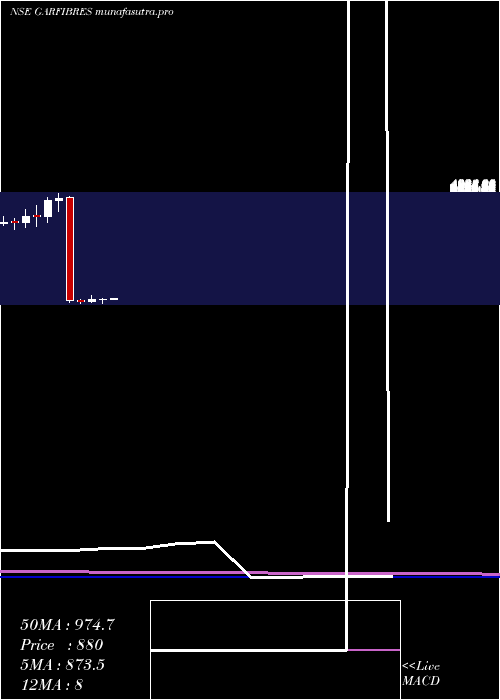
Daily price and volume Garware Tech
| Date |
Closing |
Open |
Range |
Volume |
Wed 29 October 2025 |
771.60 (-0.57%) |
778.10 |
767.15 - 781.05 |
0.4532 times |
Tue 28 October 2025 |
776.00 (0.01%) |
777.45 |
770.35 - 788.00 |
0.3842 times |
Mon 27 October 2025 |
775.90 (0.62%) |
771.15 |
760.90 - 780.00 |
0.7072 times |
Fri 24 October 2025 |
771.15 (-0.92%) |
775.00 |
760.70 - 785.95 |
0.3062 times |
Thu 23 October 2025 |
778.30 (-0.66%) |
794.10 |
775.00 - 803.85 |
1.2305 times |
Tue 21 October 2025 |
783.50 (2.38%) |
763.00 |
763.00 - 793.00 |
0.1909 times |
Mon 20 October 2025 |
765.25 (0.28%) |
760.00 |
755.00 - 775.00 |
1.0349 times |
Fri 17 October 2025 |
763.10 (-1.14%) |
776.90 |
758.40 - 786.75 |
0.6478 times |
Thu 16 October 2025 |
771.90 (2.64%) |
752.05 |
750.00 - 778.00 |
4.726 times |
Wed 15 October 2025 |
752.05 (0.28%) |
741.00 |
740.90 - 755.95 |
0.3191 times |
Tue 14 October 2025 |
749.95 (-0.09%) |
746.25 |
746.25 - 756.80 |
0.8031 times |
Weekly price and charts GarwareTech Strong weekly Stock price targets for GarwareTech GARFIBRES are 766.25 and 793.35 | Weekly Target 1 | 746.4 | | Weekly Target 2 | 759 | | Weekly Target 3 | 773.5 | | Weekly Target 4 | 786.1 | | Weekly Target 5 | 800.6 |
Weekly price and volumes for Garware Tech
| Date |
Closing |
Open |
Range |
Volume |
Wed 29 October 2025 |
771.60 (0.06%) |
771.15 |
760.90 - 788.00 |
0.3305 times |
Fri 24 October 2025 |
771.15 (1.05%) |
760.00 |
755.00 - 803.85 |
0.5912 times |
Fri 17 October 2025 |
763.10 (1.31%) |
755.00 |
732.00 - 786.75 |
1.4659 times |
Fri 10 October 2025 |
753.25 (-0.8%) |
760.00 |
743.50 - 764.90 |
2.3666 times |
Fri 03 October 2025 |
759.30 (-2.87%) |
780.40 |
734.20 - 786.90 |
1.1788 times |
Fri 26 September 2025 |
781.75 (-4.19%) |
815.95 |
771.00 - 821.00 |
0.8617 times |
Fri 19 September 2025 |
815.95 (4.96%) |
777.40 |
771.65 - 825.00 |
0.617 times |
Fri 12 September 2025 |
777.40 (1.37%) |
768.30 |
740.10 - 816.00 |
1.4907 times |
Fri 05 September 2025 |
766.90 (0.12%) |
770.90 |
760.00 - 780.00 |
0.6593 times |
Fri 29 August 2025 |
766.00 (-6%) |
815.10 |
762.00 - 823.75 |
0.4381 times |
Fri 22 August 2025 |
814.90 (3.34%) |
799.00 |
793.10 - 870.45 |
0.4818 times |
Monthly price and charts GarwareTech Strong monthly Stock price targets for GarwareTech GARFIBRES are 751.8 and 823.65 | Monthly Target 1 | 697.3 | | Monthly Target 2 | 734.45 | | Monthly Target 3 | 769.15 | | Monthly Target 4 | 806.3 | | Monthly Target 5 | 841 |
Monthly price and volumes Garware Tech
| Date |
Closing |
Open |
Range |
Volume |
Wed 29 October 2025 |
771.60 (3.84%) |
743.00 |
732.00 - 803.85 |
1.0016 times |
Tue 30 September 2025 |
743.10 (-2.99%) |
770.90 |
736.85 - 825.00 |
0.8607 times |
Fri 29 August 2025 |
766.00 (-14.77%) |
899.00 |
762.00 - 905.90 |
0.4224 times |
Thu 31 July 2025 |
898.70 (-2.9%) |
920.10 |
880.00 - 970.00 |
0.9925 times |
Mon 30 June 2025 |
925.55 (7.65%) |
860.05 |
839.00 - 941.15 |
1.0197 times |
Fri 30 May 2025 |
859.80 (-0.23%) |
851.05 |
841.00 - 943.95 |
0.9055 times |
Wed 30 April 2025 |
861.80 (-0.34%) |
856.80 |
674.20 - 901.25 |
0.846 times |
Fri 28 March 2025 |
864.70 (14.85%) |
752.00 |
737.80 - 985.55 |
1.4723 times |
Fri 28 February 2025 |
752.90 (-8.27%) |
801.35 |
690.50 - 858.55 |
0.8393 times |
Fri 31 January 2025 |
820.75 (-82.75%) |
4799.00 |
714.55 - 4804.10 |
1.6399 times |
Tue 31 December 2024 |
4757.60 (2.24%) |
4680.00 |
4227.95 - 4931.95 |
0.5039 times |
DMA SMA EMA moving averages of Garware Tech GARFIBRES
DMA (daily moving average) of Garware Tech GARFIBRES
| DMA period | DMA value | | 5 day DMA | 774.59 | | 12 day DMA | 767.45 | | 20 day DMA | 762.01 | | 35 day DMA | 773.21 | | 50 day DMA | 777.01 | | 100 day DMA | 835.21 | | 150 day DMA | 847.32 | | 200 day DMA | 831.12 | EMA (exponential moving average) of Garware Tech GARFIBRES
| EMA period | EMA current | EMA prev | EMA prev2 | | 5 day EMA | 773.27 | 774.11 | 773.17 | | 12 day EMA | 770.09 | 769.82 | 768.7 | | 20 day EMA | 769.94 | 769.76 | 769.1 | | 35 day EMA | 773.18 | 773.27 | 773.11 | | 50 day EMA | 779.87 | 780.21 | 780.38 |
SMA (simple moving average) of Garware Tech GARFIBRES
| SMA period | SMA current | SMA prev | SMA prev2 | | 5 day SMA | 774.59 | 776.97 | 774.82 | | 12 day SMA | 767.45 | 765.92 | 764.1 | | 20 day SMA | 762.01 | 761.95 | 762.24 | | 35 day SMA | 773.21 | 773.03 | 772.77 | | 50 day SMA | 777.01 | 777.35 | 777.97 | | 100 day SMA | 835.21 | 836.59 | 837.99 | | 150 day SMA | 847.32 | 847.81 | 847.95 | | 200 day SMA | 831.12 | 831.6 | 832.03 |
|
|
