GangaBath GANGABATH_ST full analysis,charts,indicators,moving averages,SMA,DMA,EMA,ADX,MACD,RSIGanga Bath GANGABATH_ST WideScreen charts, DMA,SMA,EMA technical analysis, forecast prediction, by indicators ADX,MACD,RSI,CCI NSE stock exchange
Daily price and charts and targets GangaBath Strong Daily Stock price targets for GangaBath GANGABATH_ST are 25.98 and 26.03 | Daily Target 1 | 25.93 | | Daily Target 2 | 25.97 | | Daily Target 3 | 25.983333333333 | | Daily Target 4 | 26.02 | | Daily Target 5 | 26.03 |
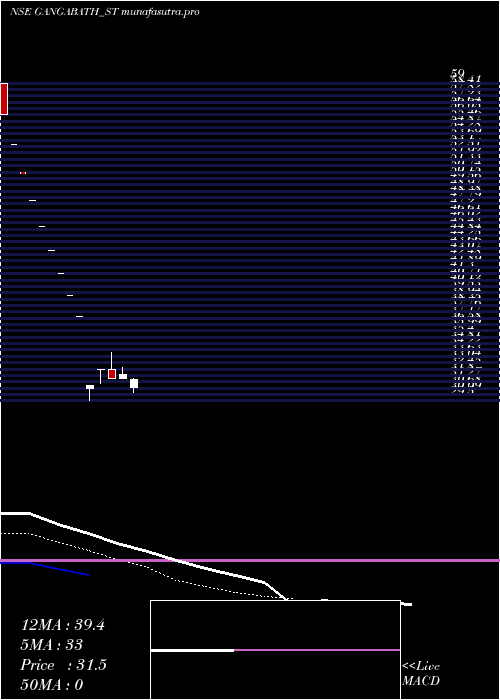
Daily price and volume Ganga Bath
| Date |
Closing |
Open |
Range |
Volume |
Wed 03 September 2025 |
26.00 (0%) |
26.00 |
25.95 - 26.00 |
0.3529 times |
Tue 02 September 2025 |
26.00 (2.36%) |
25.50 |
25.50 - 26.00 |
0.5882 times |
Mon 01 September 2025 |
25.40 (-2.31%) |
25.50 |
25.40 - 26.00 |
0.5882 times |
Thu 28 August 2025 |
26.00 (0%) |
26.00 |
25.90 - 26.90 |
0.9412 times |
Tue 26 August 2025 |
26.00 (-3.7%) |
26.00 |
26.00 - 26.10 |
0.4706 times |
Mon 25 August 2025 |
27.00 (-0.18%) |
28.00 |
25.85 - 28.00 |
1.2941 times |
Fri 22 August 2025 |
27.05 (-3.39%) |
27.85 |
27.00 - 27.85 |
1.0588 times |
Thu 21 August 2025 |
28.00 (0.18%) |
27.95 |
26.55 - 28.00 |
2 times |
Wed 20 August 2025 |
27.95 (0.72%) |
27.85 |
27.85 - 27.95 |
0.4706 times |
Tue 19 August 2025 |
27.75 (4.91%) |
27.00 |
27.00 - 27.75 |
2.2353 times |
Mon 18 August 2025 |
26.45 (4.55%) |
26.15 |
25.45 - 26.55 |
2.7059 times |
Weekly price and charts GangaBath Strong weekly Stock price targets for GangaBath GANGABATH_ST are 25.7 and 26.3 | Weekly Target 1 | 25.2 | | Weekly Target 2 | 25.6 | | Weekly Target 3 | 25.8 | | Weekly Target 4 | 26.2 | | Weekly Target 5 | 26.4 |
Weekly price and volumes for Ganga Bath
| Date |
Closing |
Open |
Range |
Volume |
Wed 03 September 2025 |
26.00 (0%) |
25.50 |
25.40 - 26.00 |
0.2207 times |
Thu 28 August 2025 |
26.00 (-3.88%) |
28.00 |
25.85 - 28.00 |
0.3905 times |
Fri 22 August 2025 |
27.05 (6.92%) |
26.15 |
25.45 - 28.00 |
1.2224 times |
Thu 14 August 2025 |
25.30 (1.2%) |
25.00 |
23.05 - 25.30 |
0.9847 times |
Fri 08 August 2025 |
25.00 (-4.94%) |
25.95 |
24.85 - 26.20 |
1.0526 times |
Fri 01 August 2025 |
26.30 (-7.07%) |
27.30 |
25.60 - 28.00 |
1.3073 times |
Fri 25 July 2025 |
28.30 (-6.91%) |
29.55 |
27.65 - 30.35 |
1.4261 times |
Fri 18 July 2025 |
30.40 (-3.34%) |
30.70 |
29.50 - 31.95 |
1.0866 times |
Fri 11 July 2025 |
31.45 (-15.68%) |
30.65 |
29.50 - 33.95 |
2.1222 times |
Tue 24 June 2025 |
37.30 (-9.69%) |
39.25 |
37.30 - 39.25 |
0.1868 times |
Fri 20 June 2025 |
41.30 (0%) |
48.10 |
41.30 - 48.10 |
0.2377 times |

Monthly price and charts GangaBath Strong monthly Stock price targets for GangaBath GANGABATH_ST are 25.7 and 26.3 | Monthly Target 1 | 25.2 | | Monthly Target 2 | 25.6 | | Monthly Target 3 | 25.8 | | Monthly Target 4 | 26.2 | | Monthly Target 5 | 26.4 |
Monthly price and volumes Ganga Bath
| Date |
Closing |
Open |
Range |
Volume |
Wed 03 September 2025 |
26.00 (0%) |
25.50 |
25.40 - 26.00 |
0.046 times |
Thu 28 August 2025 |
26.00 (-1.89%) |
26.50 |
23.05 - 28.00 |
0.8064 times |
Thu 31 July 2025 |
26.50 (-28.95%) |
30.65 |
25.60 - 33.95 |
1.1919 times |
Tue 24 June 2025 |
37.30 (0%) |
59.00 |
37.30 - 59.00 |
1.9558 times |
Wed 03 September 2025 |
(0%) |
|
- |
0 times |

DMA SMA EMA moving averages of Ganga Bath GANGABATH_ST
DMA (daily moving average) of Ganga Bath GANGABATH_ST
| DMA period | DMA value | | 5 day DMA | 25.88 | | 12 day DMA | 26.58 | | 20 day DMA | 25.94 | | 35 day DMA | 27.23 | | 50 day DMA | | | 100 day DMA | | | 150 day DMA | | | 200 day DMA | | EMA (exponential moving average) of Ganga Bath GANGABATH_ST
| EMA period | EMA current | EMA prev | EMA prev2 | | 5 day EMA | 26.06 | 26.09 | 26.13 | | 12 day EMA | 26.25 | 26.3 | 26.36 | | 20 day EMA | 26.88 | 26.97 | 27.07 | | 35 day EMA | 29.33 | 29.53 | 29.74 | | 50 day EMA | 0 | 0 | 0 |
SMA (simple moving average) of Ganga Bath GANGABATH_ST
| SMA period | SMA current | SMA prev | SMA prev2 | | 5 day SMA | 25.88 | 26.08 | 26.29 | | 12 day SMA | 26.58 | 26.45 | 26.25 | | 20 day SMA | 25.94 | 25.96 | 25.98 | | 35 day SMA | 27.23 | 27.39 | 27.56 | | 50 day SMA | | 100 day SMA | | 150 day SMA | | 200 day SMA |
|
|
