GaneshHousing GANESHHOUC full analysis,charts,indicators,moving averages,SMA,DMA,EMA,ADX,MACD,RSIGanesh Housing GANESHHOUC WideScreen charts, DMA,SMA,EMA technical analysis, forecast prediction, by indicators ADX,MACD,RSI,CCI NSE stock exchange
operates under Realty sector
Daily price and charts and targets GaneshHousing Strong Daily Stock price targets for GaneshHousing GANESHHOUC are 868.35 and 894.35 | Daily Target 1 | 848.23 | | Daily Target 2 | 862.47 | | Daily Target 3 | 874.23333333333 | | Daily Target 4 | 888.47 | | Daily Target 5 | 900.23 |
Daily price and volume Ganesh Housing
| Date |
Closing |
Open |
Range |
Volume |
Wed 03 September 2025 |
876.70 (1.28%) |
865.00 |
860.00 - 886.00 |
1.0089 times |
Tue 02 September 2025 |
865.65 (3.73%) |
835.20 |
834.00 - 870.00 |
1.5673 times |
Mon 01 September 2025 |
834.50 (-2.85%) |
860.80 |
831.00 - 862.45 |
2.5171 times |
Fri 29 August 2025 |
859.00 (-0.65%) |
870.00 |
852.70 - 895.95 |
0.8434 times |
Thu 28 August 2025 |
864.60 (-2.38%) |
885.70 |
860.00 - 894.70 |
1.1185 times |
Tue 26 August 2025 |
885.70 (-0.8%) |
891.00 |
880.00 - 907.10 |
0.7295 times |
Mon 25 August 2025 |
892.85 (-0.78%) |
902.90 |
892.00 - 908.40 |
0.4734 times |
Fri 22 August 2025 |
899.85 (0.05%) |
898.00 |
891.20 - 914.00 |
0.564 times |
Thu 21 August 2025 |
899.40 (-0.19%) |
908.70 |
894.55 - 920.15 |
0.7662 times |
Wed 20 August 2025 |
901.15 (0.3%) |
896.00 |
894.10 - 907.45 |
0.4117 times |
Tue 19 August 2025 |
898.45 (-0.43%) |
894.00 |
889.50 - 917.00 |
1.0377 times |
Weekly price and charts GaneshHousing Strong weekly Stock price targets for GaneshHousing GANESHHOUC are 853.85 and 908.85 | Weekly Target 1 | 809.57 | | Weekly Target 2 | 843.13 | | Weekly Target 3 | 864.56666666667 | | Weekly Target 4 | 898.13 | | Weekly Target 5 | 919.57 |
Weekly price and volumes for Ganesh Housing
| Date |
Closing |
Open |
Range |
Volume |
Wed 03 September 2025 |
876.70 (2.06%) |
860.80 |
831.00 - 886.00 |
0.7066 times |
Fri 29 August 2025 |
859.00 (-4.54%) |
902.90 |
852.70 - 908.40 |
0.439 times |
Fri 22 August 2025 |
899.85 (3.99%) |
868.00 |
868.00 - 920.15 |
0.5638 times |
Thu 14 August 2025 |
865.30 (0.73%) |
859.90 |
854.40 - 874.80 |
0.4326 times |
Fri 08 August 2025 |
859.05 (-2.87%) |
884.40 |
850.05 - 916.00 |
0.7742 times |
Fri 01 August 2025 |
884.40 (-0.39%) |
888.00 |
872.00 - 910.20 |
0.7174 times |
Fri 25 July 2025 |
887.90 (-9.45%) |
982.00 |
886.00 - 983.00 |
2.3301 times |
Fri 18 July 2025 |
980.55 (-1.52%) |
995.05 |
966.00 - 1020.00 |
0.9787 times |
Fri 11 July 2025 |
995.70 (2.01%) |
981.00 |
981.00 - 1050.00 |
2.4163 times |
Fri 04 July 2025 |
976.10 (-0.46%) |
980.90 |
960.25 - 998.90 |
0.6413 times |
Fri 27 June 2025 |
980.60 (2.72%) |
951.30 |
945.50 - 1008.00 |
0.8223 times |
Monthly price and charts GaneshHousing Strong monthly Stock price targets for GaneshHousing GANESHHOUC are 853.85 and 908.85 | Monthly Target 1 | 809.57 | | Monthly Target 2 | 843.13 | | Monthly Target 3 | 864.56666666667 | | Monthly Target 4 | 898.13 | | Monthly Target 5 | 919.57 |
Monthly price and volumes Ganesh Housing
| Date |
Closing |
Open |
Range |
Volume |
Wed 03 September 2025 |
876.70 (2.06%) |
860.80 |
831.00 - 886.00 |
0.0899 times |
Fri 29 August 2025 |
859.00 (-3.94%) |
894.00 |
850.05 - 920.15 |
0.2997 times |
Thu 31 July 2025 |
894.20 (-9.79%) |
993.70 |
873.20 - 1050.00 |
0.8678 times |
Mon 30 June 2025 |
991.20 (-1.49%) |
999.50 |
930.00 - 1079.80 |
0.6774 times |
Fri 30 May 2025 |
1006.20 (-7.67%) |
1089.60 |
910.00 - 1145.00 |
1.6231 times |
Wed 30 April 2025 |
1089.80 (2.89%) |
1059.00 |
852.85 - 1169.00 |
0.8148 times |
Fri 28 March 2025 |
1059.15 (-2.17%) |
1065.00 |
967.05 - 1147.65 |
1.0445 times |
Fri 28 February 2025 |
1082.65 (-20.08%) |
1355.00 |
1064.05 - 1485.00 |
1.0389 times |
Fri 31 January 2025 |
1354.70 (7.61%) |
1258.00 |
1139.05 - 1485.00 |
2.7228 times |
Tue 31 December 2024 |
1258.90 (-0.66%) |
1267.00 |
1132.10 - 1340.45 |
0.8211 times |
Fri 29 November 2024 |
1267.25 (18.05%) |
1097.95 |
1020.05 - 1287.45 |
1.6888 times |
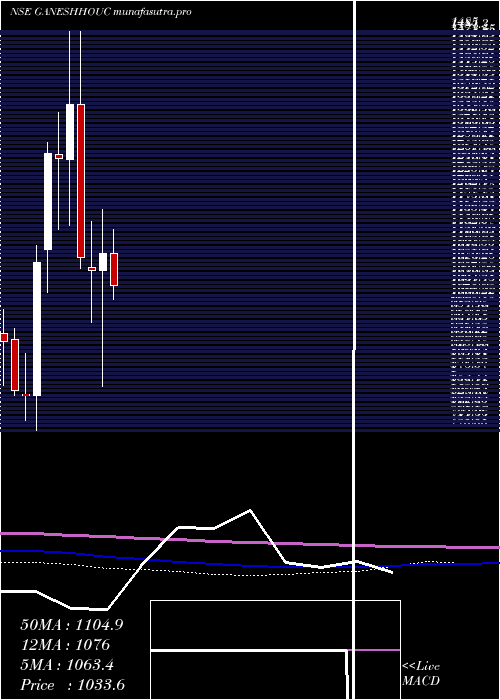
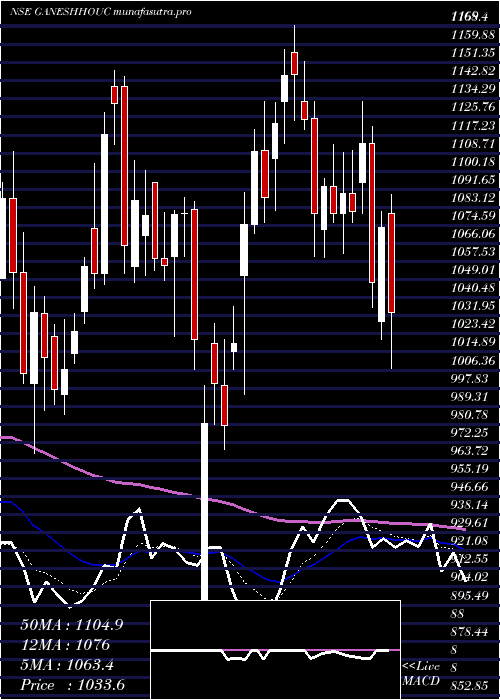
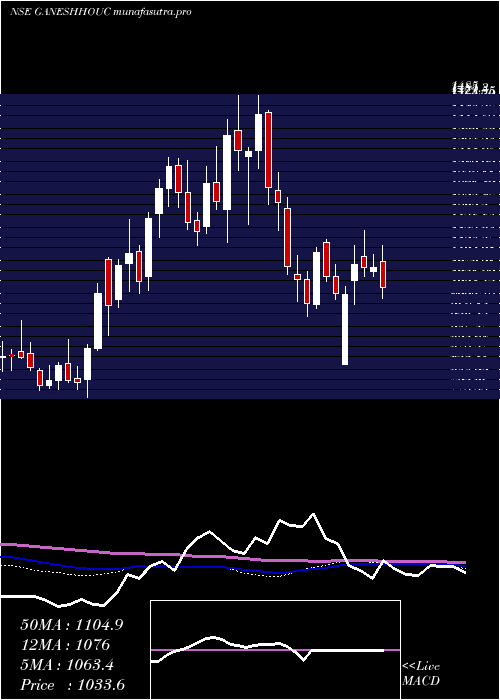
DMA SMA EMA moving averages of Ganesh Housing GANESHHOUC
DMA (daily moving average) of Ganesh Housing GANESHHOUC
| DMA period | DMA value | | 5 day DMA | 860.09 | | 12 day DMA | 881.68 | | 20 day DMA | 875.73 | | 35 day DMA | 897.91 | | 50 day DMA | 926.44 | | 100 day DMA | 979.45 | | 150 day DMA | 1044.64 | | 200 day DMA | 1094.31 | EMA (exponential moving average) of Ganesh Housing GANESHHOUC
| EMA period | EMA current | EMA prev | EMA prev2 | | 5 day EMA | 867.42 | 862.78 | 861.35 | | 12 day EMA | 873.92 | 873.42 | 874.83 | | 20 day EMA | 881.79 | 882.33 | 884.09 | | 35 day EMA | 902.08 | 903.57 | 905.8 | | 50 day EMA | 922.23 | 924.09 | 926.47 |
SMA (simple moving average) of Ganesh Housing GANESHHOUC
| SMA period | SMA current | SMA prev | SMA prev2 | | 5 day SMA | 860.09 | 861.89 | 867.33 | | 12 day SMA | 881.68 | 880.73 | 881.19 | | 20 day SMA | 875.73 | 877.48 | 878.42 | | 35 day SMA | 897.91 | 901.04 | 904.76 | | 50 day SMA | 926.44 | 928.03 | 929.81 | | 100 day SMA | 979.45 | 980.68 | 981.84 | | 150 day SMA | 1044.64 | 1047.82 | 1051.33 | | 200 day SMA | 1094.31 | 1095.46 | 1096.7 |
|
|
