GajanandInternational GAJANAND_ST full analysis,charts,indicators,moving averages,SMA,DMA,EMA,ADX,MACD,RSIGajanand International GAJANAND_ST WideScreen charts, DMA,SMA,EMA technical analysis, forecast prediction, by indicators ADX,MACD,RSI,CCI NSE stock exchange
Daily price and charts and targets GajanandInternational Strong Daily Stock price targets for GajanandInternational GAJANAND_ST are 12.48 and 13.13 | Daily Target 1 | 12.33 | | Daily Target 2 | 12.57 | | Daily Target 3 | 12.983333333333 | | Daily Target 4 | 13.22 | | Daily Target 5 | 13.63 |
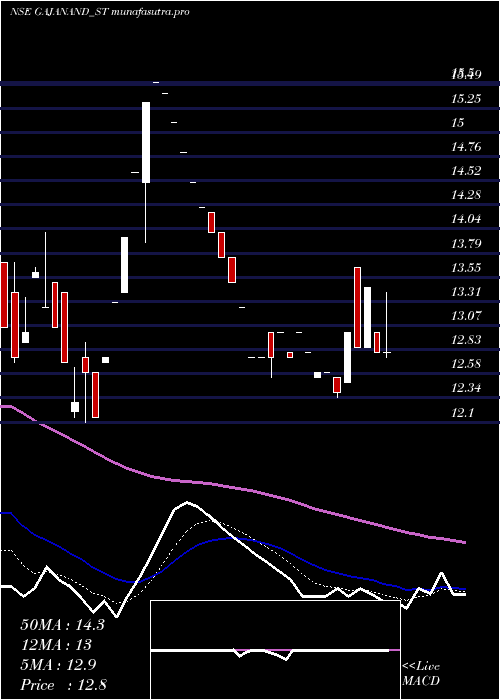
Daily price and volume Gajanand International
| Date |
Closing |
Open |
Range |
Volume |
| Fri 02 May 2025 |
12.80 (0%) |
12.80 |
12.75 - 13.40 |
1.6279 times |
| Wed 30 April 2025 |
12.80 (-4.83%) |
13.00 |
12.80 - 13.00 |
0.6977 times |
| Thu 24 April 2025 |
13.45 (4.67%) |
12.85 |
12.85 - 13.45 |
1.3953 times |
| Tue 22 April 2025 |
12.85 (-1.15%) |
13.65 |
12.85 - 13.65 |
1.3953 times |
| Mon 21 April 2025 |
13.00 (4.84%) |
12.50 |
12.50 - 13.00 |
0.6977 times |
| Thu 17 April 2025 |
12.40 (-1.59%) |
12.55 |
12.35 - 12.55 |
2.5581 times |
| Wed 16 April 2025 |
12.60 (0%) |
12.60 |
12.60 - 12.60 |
0.4651 times |
| Tue 15 April 2025 |
12.60 (-1.56%) |
12.55 |
12.55 - 12.60 |
0.6977 times |
| Fri 11 April 2025 |
12.80 (-1.54%) |
12.80 |
12.80 - 12.80 |
0.2326 times |
| Tue 08 April 2025 |
13.00 (1.96%) |
13.00 |
13.00 - 13.00 |
0.2326 times |
| Mon 07 April 2025 |
12.75 (-1.92%) |
12.80 |
12.75 - 12.80 |
0.6977 times |
Weekly price and charts GajanandInternational Strong weekly Stock price targets for GajanandInternational GAJANAND_ST are 12.45 and 13.1 | Weekly Target 1 | 12.33 | | Weekly Target 2 | 12.57 | | Weekly Target 3 | 12.983333333333 | | Weekly Target 4 | 13.22 | | Weekly Target 5 | 13.63 |
Weekly price and volumes for Gajanand International
| Date |
Closing |
Open |
Range |
Volume |
| Fri 02 May 2025 |
12.80 (-4.83%) |
13.00 |
12.75 - 13.40 |
0.5464 times |
| Thu 24 April 2025 |
13.45 (8.47%) |
12.50 |
12.50 - 13.65 |
0.8197 times |
| Thu 17 April 2025 |
12.40 (-3.13%) |
12.55 |
12.35 - 12.60 |
0.8743 times |
| Fri 11 April 2025 |
12.80 (-1.54%) |
12.80 |
12.75 - 13.00 |
0.2732 times |
| Fri 04 April 2025 |
13.00 (1.96%) |
12.75 |
12.55 - 13.00 |
0.3825 times |
| Fri 28 March 2025 |
12.75 (-8.93%) |
14.00 |
12.75 - 14.00 |
1.2568 times |
| Fri 21 March 2025 |
14.00 (-9.09%) |
15.10 |
14.00 - 15.10 |
0.765 times |
| Thu 13 March 2025 |
15.40 (10.39%) |
14.60 |
13.90 - 15.50 |
2.4044 times |
| Fri 07 March 2025 |
13.95 (13.41%) |
12.75 |
12.10 - 13.95 |
1.3115 times |
| Fri 28 February 2025 |
12.30 (-9.56%) |
13.25 |
12.15 - 14.00 |
1.3661 times |
| Fri 21 February 2025 |
13.60 (-5.23%) |
13.70 |
12.70 - 13.95 |
2.9508 times |
Monthly price and charts GajanandInternational Strong monthly Stock price targets for GajanandInternational GAJANAND_ST are 12.48 and 13.13 | Monthly Target 1 | 12.33 | | Monthly Target 2 | 12.57 | | Monthly Target 3 | 12.983333333333 | | Monthly Target 4 | 13.22 | | Monthly Target 5 | 13.63 |
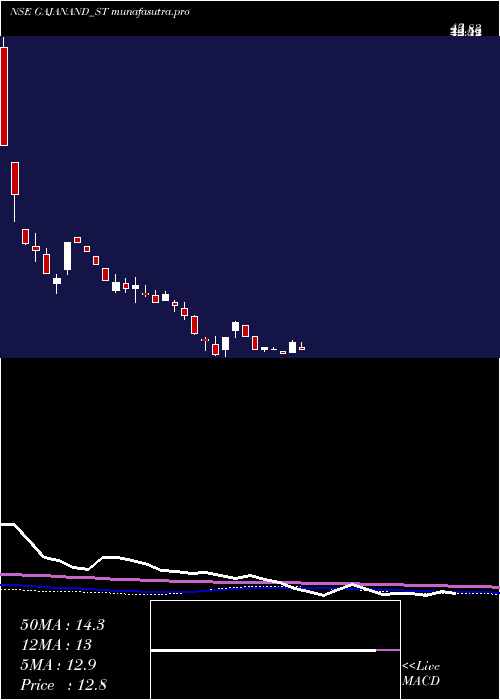
Monthly price and volumes Gajanand International
| Date |
Closing |
Open |
Range |
Volume |
| Fri 02 May 2025 |
12.80 (0%) |
12.80 |
12.75 - 13.40 |
0.0372 times |
| Wed 30 April 2025 |
12.80 (0.39%) |
12.75 |
12.35 - 13.65 |
0.2447 times |
| Fri 28 March 2025 |
12.75 (3.66%) |
12.75 |
12.10 - 15.50 |
0.5585 times |
| Fri 28 February 2025 |
12.30 (-27.65%) |
16.75 |
12.15 - 17.30 |
0.7447 times |
| Fri 31 January 2025 |
17.00 (-9.81%) |
18.70 |
16.45 - 19.75 |
0.5904 times |
| Tue 31 December 2024 |
18.85 (-13.53%) |
21.40 |
17.35 - 21.40 |
0.7287 times |
| Mon 25 November 2024 |
21.80 (15.96%) |
18.50 |
18.50 - 23.60 |
0.4309 times |
| Thu 31 October 2024 |
18.80 (-32.37%) |
24.35 |
18.20 - 24.35 |
1.3351 times |
| Fri 27 September 2024 |
27.80 (0%) |
42.00 |
25.20 - 43.00 |
4.3298 times |
| Thu 08 May 2025 |
(0%) |
|
- |
0 times |

DMA SMA EMA moving averages of Gajanand International GAJANAND_ST
DMA (daily moving average) of Gajanand International GAJANAND_ST
| DMA period | DMA value | | 5 day DMA | 12.98 | | 12 day DMA | 12.84 | | 20 day DMA | 13.05 | | 35 day DMA | 13.4 | | 50 day DMA | 13.8 | | 100 day DMA | 16.59 | | 150 day DMA | | | 200 day DMA | | EMA (exponential moving average) of Gajanand International GAJANAND_ST
| EMA period | EMA current | EMA prev | EMA prev2 | | 5 day EMA | 12.89 | 12.93 | 13 | | 12 day EMA | 12.95 | 12.98 | 13.01 | | 20 day EMA | 13.13 | 13.17 | 13.21 | | 35 day EMA | 13.53 | 13.57 | 13.62 | | 50 day EMA | 14.02 | 14.07 | 14.12 |
SMA (simple moving average) of Gajanand International GAJANAND_ST
| SMA period | SMA current | SMA prev | SMA prev2 | | 5 day SMA | 12.98 | 12.9 | 12.86 | | 12 day SMA | 12.84 | 12.83 | 12.83 | | 20 day SMA | 13.05 | 13.14 | 13.24 | | 35 day SMA | 13.4 | 13.41 | 13.44 | | 50 day SMA | 13.8 | 13.88 | 13.97 | | 100 day SMA | 16.59 | 16.66 | 16.73 | | 150 day SMA | | 200 day SMA |
|
|
