GajanandInternational GAJANAND_SM full analysis,charts,indicators,moving averages,SMA,DMA,EMA,ADX,MACD,RSIGajanand International GAJANAND_SM WideScreen charts, DMA,SMA,EMA technical analysis, forecast prediction, by indicators ADX,MACD,RSI,CCI NSE stock exchange
Daily price and charts and targets GajanandInternational Strong Daily Stock price targets for GajanandInternational GAJANAND_SM are 10.8 and 11.4 | Daily Target 1 | 10.7 | | Daily Target 2 | 10.9 | | Daily Target 3 | 11.3 | | Daily Target 4 | 11.5 | | Daily Target 5 | 11.9 |
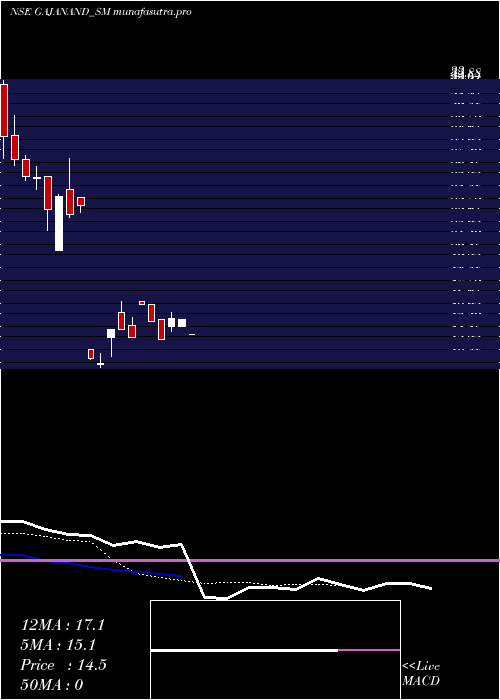
Daily price and volume Gajanand International
| Date |
Closing |
Open |
Range |
Volume |
Wed 29 October 2025 |
11.10 (-5.13%) |
11.70 |
11.10 - 11.70 |
0.7692 times |
Fri 24 October 2025 |
11.70 (-5.65%) |
11.85 |
11.70 - 11.85 |
1.5385 times |
Thu 23 October 2025 |
12.40 (7.83%) |
11.50 |
11.50 - 12.95 |
3.0769 times |
Tue 21 October 2025 |
11.50 (0%) |
11.50 |
11.50 - 11.50 |
0.3846 times |
Thu 16 October 2025 |
11.50 (3.14%) |
11.50 |
11.50 - 11.50 |
0.7692 times |
Wed 15 October 2025 |
11.15 (-2.62%) |
11.85 |
11.15 - 11.85 |
0.7692 times |
Tue 14 October 2025 |
11.45 (-1.29%) |
12.00 |
11.10 - 12.00 |
1.1538 times |
Mon 13 October 2025 |
11.60 (0%) |
11.60 |
11.60 - 11.60 |
0.3846 times |
Fri 10 October 2025 |
11.60 (1.31%) |
12.00 |
11.60 - 12.00 |
0.7692 times |
Thu 09 October 2025 |
11.45 (-0.43%) |
11.45 |
11.45 - 11.45 |
0.3846 times |
Wed 08 October 2025 |
11.50 (-3.36%) |
10.60 |
10.60 - 12.30 |
1.5385 times |
Weekly price and charts GajanandInternational Strong weekly Stock price targets for GajanandInternational GAJANAND_SM are 10.8 and 11.4 | Weekly Target 1 | 10.7 | | Weekly Target 2 | 10.9 | | Weekly Target 3 | 11.3 | | Weekly Target 4 | 11.5 | | Weekly Target 5 | 11.9 |
Weekly price and volumes for Gajanand International
| Date |
Closing |
Open |
Range |
Volume |
Wed 29 October 2025 |
11.10 (-5.13%) |
11.70 |
11.10 - 11.70 |
0.202 times |
Fri 24 October 2025 |
11.70 (1.74%) |
11.50 |
11.50 - 12.95 |
1.3131 times |
Thu 16 October 2025 |
11.50 (-0.86%) |
11.60 |
11.10 - 12.00 |
0.8081 times |
Fri 10 October 2025 |
11.60 (-2.52%) |
10.60 |
10.60 - 12.30 |
0.7071 times |
Fri 03 October 2025 |
11.90 (-2.06%) |
11.90 |
9.65 - 12.00 |
1.2121 times |
Thu 25 September 2025 |
12.15 (-6.9%) |
12.40 |
12.15 - 12.75 |
1.3131 times |
Fri 19 September 2025 |
13.05 (8.75%) |
12.00 |
11.75 - 13.15 |
1.8182 times |
Wed 10 September 2025 |
12.00 (-1.23%) |
12.15 |
12.00 - 12.20 |
0.303 times |
Thu 04 September 2025 |
12.15 (0.41%) |
12.75 |
12.10 - 13.00 |
1.5152 times |
Fri 29 August 2025 |
12.10 (-6.2%) |
13.25 |
12.10 - 13.25 |
0.8081 times |
Fri 22 August 2025 |
12.90 (5.31%) |
12.10 |
12.10 - 13.15 |
1.3131 times |

Monthly price and charts GajanandInternational Strong monthly Stock price targets for GajanandInternational GAJANAND_SM are 8.73 and 12.03 | Monthly Target 1 | 7.93 | | Monthly Target 2 | 9.52 | | Monthly Target 3 | 11.233333333333 | | Monthly Target 4 | 12.82 | | Monthly Target 5 | 14.53 |
Monthly price and volumes Gajanand International
| Date |
Closing |
Open |
Range |
Volume |
Wed 29 October 2025 |
11.10 (-6.33%) |
11.55 |
9.65 - 12.95 |
0.3241 times |
Tue 30 September 2025 |
11.85 (-2.07%) |
12.75 |
11.55 - 13.15 |
0.452 times |
Fri 29 August 2025 |
12.10 (-6.2%) |
12.55 |
12.10 - 13.25 |
0.3241 times |
Thu 31 July 2025 |
12.90 (-8.19%) |
14.30 |
12.40 - 14.30 |
1.0917 times |
Mon 30 June 2025 |
14.05 (4.07%) |
13.50 |
12.30 - 14.50 |
0.9723 times |
Fri 30 May 2025 |
13.50 (-43.4%) |
13.30 |
12.00 - 16.85 |
0.6397 times |
Thu 10 October 2024 |
23.85 (-17.47%) |
29.00 |
20.55 - 30.45 |
2.7292 times |
Mon 30 September 2024 |
28.90 (0%) |
32.70 |
27.30 - 33.00 |
1.467 times |
Thu 30 October 2025 |
(0%) |
|
- |
0 times |

DMA SMA EMA moving averages of Gajanand International GAJANAND_SM
DMA (daily moving average) of Gajanand International GAJANAND_SM
| DMA period | DMA value | | 5 day DMA | 11.64 | | 12 day DMA | 11.57 | | 20 day DMA | 11.83 | | 35 day DMA | 12.09 | | 50 day DMA | 12.27 | | 100 day DMA | 13.07 | | 150 day DMA | | | 200 day DMA | | EMA (exponential moving average) of Gajanand International GAJANAND_SM
| EMA period | EMA current | EMA prev | EMA prev2 | | 5 day EMA | 11.53 | 11.75 | 11.78 | | 12 day EMA | 11.65 | 11.75 | 11.76 | | 20 day EMA | 11.79 | 11.86 | 11.88 | | 35 day EMA | 12.03 | 12.08 | 12.1 | | 50 day EMA | 12.26 | 12.31 | 12.34 |
SMA (simple moving average) of Gajanand International GAJANAND_SM
| SMA period | SMA current | SMA prev | SMA prev2 | | 5 day SMA | 11.64 | 11.65 | 11.6 | | 12 day SMA | 11.57 | 11.64 | 11.65 | | 20 day SMA | 11.83 | 11.92 | 11.95 | | 35 day SMA | 12.09 | 12.12 | 12.15 | | 50 day SMA | 12.27 | 12.3 | 12.33 | | 100 day SMA | 13.07 | 13.19 | 13.32 | | 150 day SMA | | 200 day SMA |
|
|
