FusionMicro FUSION full analysis,charts,indicators,moving averages,SMA,DMA,EMA,ADX,MACD,RSIFusion Micro FUSION WideScreen charts, DMA,SMA,EMA technical analysis, forecast prediction, by indicators ADX,MACD,RSI,CCI NSE stock exchange
Daily price and charts and targets FusionMicro Strong Daily Stock price targets for FusionMicro FUSION are 183.02 and 187.65 | Daily Target 1 | 179.27 | | Daily Target 2 | 182.13 | | Daily Target 3 | 183.90333333333 | | Daily Target 4 | 186.76 | | Daily Target 5 | 188.53 |
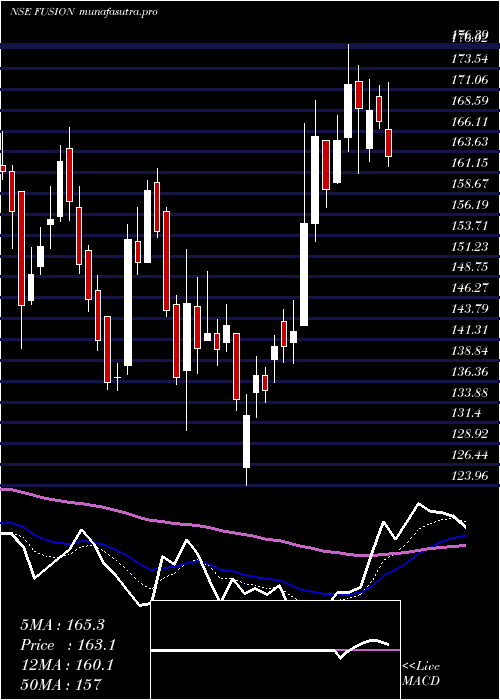
Daily price and volume Fusion Micro
| Date |
Closing |
Open |
Range |
Volume |
Wed 29 October 2025 |
184.98 (0.53%) |
183.05 |
181.05 - 185.68 |
0.578 times |
Tue 28 October 2025 |
184.01 (1.84%) |
181.84 |
180.05 - 185.71 |
0.9057 times |
Mon 27 October 2025 |
180.69 (-0.89%) |
182.32 |
179.21 - 184.00 |
1.1298 times |
Fri 24 October 2025 |
182.32 (-0.73%) |
183.99 |
180.36 - 186.00 |
1.2624 times |
Thu 23 October 2025 |
183.66 (0.23%) |
186.99 |
182.75 - 189.36 |
1.2637 times |
Tue 21 October 2025 |
183.23 (1.36%) |
180.51 |
180.00 - 184.74 |
0.2282 times |
Mon 20 October 2025 |
180.78 (-0.96%) |
185.00 |
180.00 - 185.00 |
0.5089 times |
Fri 17 October 2025 |
182.54 (0.65%) |
182.19 |
180.00 - 183.03 |
1.1963 times |
Thu 16 October 2025 |
181.36 (-4.37%) |
189.55 |
176.21 - 191.79 |
2.3514 times |
Wed 15 October 2025 |
189.65 (-1.19%) |
191.74 |
189.00 - 192.73 |
0.5754 times |
Tue 14 October 2025 |
191.94 (-0.54%) |
193.00 |
190.59 - 194.34 |
1.2675 times |
Weekly price and charts FusionMicro Strong weekly Stock price targets for FusionMicro FUSION are 182.1 and 188.6 | Weekly Target 1 | 176.8 | | Weekly Target 2 | 180.89 | | Weekly Target 3 | 183.3 | | Weekly Target 4 | 187.39 | | Weekly Target 5 | 189.8 |
Weekly price and volumes for Fusion Micro
| Date |
Closing |
Open |
Range |
Volume |
Wed 29 October 2025 |
184.98 (1.46%) |
182.32 |
179.21 - 185.71 |
0.3527 times |
Fri 24 October 2025 |
182.32 (-0.12%) |
185.00 |
180.00 - 189.36 |
0.4404 times |
Fri 17 October 2025 |
182.54 (-5.75%) |
193.00 |
176.21 - 194.56 |
0.8271 times |
Fri 10 October 2025 |
193.68 (0.26%) |
194.49 |
188.91 - 195.51 |
0.9018 times |
Fri 03 October 2025 |
193.17 (1.53%) |
194.00 |
188.00 - 196.50 |
1.2411 times |
Fri 26 September 2025 |
190.26 (0.24%) |
189.95 |
186.91 - 196.70 |
2.1961 times |
Fri 19 September 2025 |
189.81 (1.95%) |
185.50 |
178.25 - 191.00 |
1.2368 times |
Fri 12 September 2025 |
186.18 (6.4%) |
174.98 |
171.50 - 189.50 |
1.1758 times |
Fri 05 September 2025 |
174.98 (2.62%) |
170.25 |
168.60 - 176.48 |
0.8587 times |
Fri 29 August 2025 |
170.51 (1.99%) |
168.00 |
164.25 - 173.99 |
0.7695 times |
Fri 22 August 2025 |
167.19 (13.34%) |
150.00 |
149.95 - 170.01 |
1.4474 times |

Monthly price and charts FusionMicro Strong monthly Stock price targets for FusionMicro FUSION are 170.95 and 190.25 | Monthly Target 1 | 166.27 | | Monthly Target 2 | 175.62 | | Monthly Target 3 | 185.56666666667 | | Monthly Target 4 | 194.92 | | Monthly Target 5 | 204.87 |
Monthly price and volumes Fusion Micro
| Date |
Closing |
Open |
Range |
Volume |
Wed 29 October 2025 |
184.98 (-3.56%) |
192.76 |
176.21 - 195.51 |
0.3582 times |
Tue 30 September 2025 |
191.81 (12.49%) |
170.25 |
168.60 - 196.70 |
0.7788 times |
Fri 29 August 2025 |
170.51 (4.63%) |
162.97 |
144.21 - 173.99 |
0.5118 times |
Thu 31 July 2025 |
162.96 (-17.92%) |
199.00 |
161.99 - 202.12 |
0.7751 times |
Mon 30 June 2025 |
198.55 (16.73%) |
170.09 |
163.30 - 211.80 |
2.3152 times |
Fri 30 May 2025 |
170.09 (4.27%) |
163.25 |
148.51 - 190.00 |
1.29 times |
Wed 30 April 2025 |
163.12 (16.29%) |
141.16 |
123.96 - 176.39 |
1.8962 times |
Fri 28 March 2025 |
140.27 (-10.42%) |
158.95 |
130.50 - 166.48 |
0.9398 times |
Fri 28 February 2025 |
156.58 (-11.48%) |
170.41 |
152.11 - 196.69 |
0.4723 times |
Fri 31 January 2025 |
176.88 (-0.32%) |
180.48 |
157.10 - 198.70 |
0.6626 times |
Tue 31 December 2024 |
177.44 (-1.87%) |
180.00 |
167.60 - 201.50 |
0.4327 times |

DMA SMA EMA moving averages of Fusion Micro FUSION
DMA (daily moving average) of Fusion Micro FUSION
| DMA period | DMA value | | 5 day DMA | 183.13 | | 12 day DMA | 184.85 | | 20 day DMA | 188.01 | | 35 day DMA | 186.82 | | 50 day DMA | 181.09 | | 100 day DMA | 181.31 | | 150 day DMA | 174.29 | | 200 day DMA | 172.36 | EMA (exponential moving average) of Fusion Micro FUSION
| EMA period | EMA current | EMA prev | EMA prev2 | | 5 day EMA | 183.66 | 183 | 182.49 | | 12 day EMA | 184.84 | 184.81 | 184.95 | | 20 day EMA | 185.31 | 185.34 | 185.48 | | 35 day EMA | 182.26 | 182.1 | 181.99 | | 50 day EMA | 178.81 | 178.56 | 178.34 |
SMA (simple moving average) of Fusion Micro FUSION
| SMA period | SMA current | SMA prev | SMA prev2 | | 5 day SMA | 183.13 | 182.78 | 182.14 | | 12 day SMA | 184.85 | 185.57 | 186.29 | | 20 day SMA | 188.01 | 188.31 | 188.62 | | 35 day SMA | 186.82 | 186.53 | 186.27 | | 50 day SMA | 181.09 | 180.34 | 179.7 | | 100 day SMA | 181.31 | 181.17 | 180.98 | | 150 day SMA | 174.29 | 174.06 | 173.85 | | 200 day SMA | 172.36 | 172.32 | 172.27 |
|
|
