FirstsourceSolutions FSL full analysis,charts,indicators,moving averages,SMA,DMA,EMA,ADX,MACD,RSIFirstsource Solutions FSL WideScreen charts, DMA,SMA,EMA technical analysis, forecast prediction, by indicators ADX,MACD,RSI,CCI NSE stock exchange
operates under BPO sector
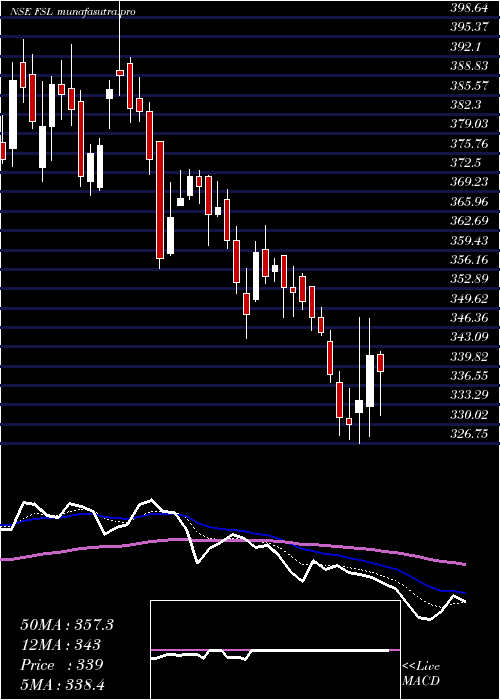
Daily price and charts and targets FirstsourceSolutions Strong Daily Stock price targets for FirstsourceSolutions FSL are 337.25 and 348.75 | Daily Target 1 | 335.1 | | Daily Target 2 | 339.4 | | Daily Target 3 | 346.6 | | Daily Target 4 | 350.9 | | Daily Target 5 | 358.1 |
Daily price and volume Firstsource Solutions
| Date |
Closing |
Open |
Range |
Volume |
Tue 28 October 2025 |
343.70 (-2.54%) |
350.00 |
342.30 - 353.80 |
0.8114 times |
Mon 27 October 2025 |
352.65 (8.06%) |
328.00 |
325.70 - 356.00 |
6.8786 times |
Fri 24 October 2025 |
326.35 (1.64%) |
321.00 |
320.20 - 329.00 |
0.3943 times |
Thu 23 October 2025 |
321.10 (-0.22%) |
324.00 |
319.45 - 328.50 |
0.5877 times |
Tue 21 October 2025 |
321.80 (1.05%) |
319.95 |
319.00 - 323.95 |
0.034 times |
Mon 20 October 2025 |
318.45 (-2.57%) |
325.30 |
317.80 - 326.85 |
0.2328 times |
Fri 17 October 2025 |
326.85 (0.46%) |
326.35 |
321.45 - 329.80 |
0.2888 times |
Thu 16 October 2025 |
325.35 (0.63%) |
323.50 |
322.50 - 327.95 |
0.2428 times |
Wed 15 October 2025 |
323.30 (-0.48%) |
326.00 |
322.45 - 326.40 |
0.1564 times |
Tue 14 October 2025 |
324.85 (-1.02%) |
327.50 |
320.80 - 328.15 |
0.3731 times |
Mon 13 October 2025 |
328.20 (-1.8%) |
331.00 |
322.20 - 331.95 |
0.4242 times |
Weekly price and charts FirstsourceSolutions Strong weekly Stock price targets for FirstsourceSolutions FSL are 334.7 and 365 | Weekly Target 1 | 311.5 | | Weekly Target 2 | 327.6 | | Weekly Target 3 | 341.8 | | Weekly Target 4 | 357.9 | | Weekly Target 5 | 372.1 |
Weekly price and volumes for Firstsource Solutions
| Date |
Closing |
Open |
Range |
Volume |
Tue 28 October 2025 |
343.70 (5.32%) |
328.00 |
325.70 - 356.00 |
3.382 times |
Fri 24 October 2025 |
326.35 (-0.15%) |
325.30 |
317.80 - 329.00 |
0.5493 times |
Fri 17 October 2025 |
326.85 (-2.2%) |
331.00 |
320.80 - 331.95 |
0.6532 times |
Fri 10 October 2025 |
334.20 (3.97%) |
322.55 |
321.70 - 337.65 |
0.6097 times |
Fri 03 October 2025 |
321.45 (-8.58%) |
353.60 |
316.40 - 355.00 |
1.6226 times |
Fri 26 September 2025 |
351.60 (-6.44%) |
369.00 |
348.10 - 374.50 |
0.5575 times |
Fri 19 September 2025 |
375.80 (2.05%) |
368.25 |
361.60 - 379.70 |
0.5736 times |
Fri 12 September 2025 |
368.25 (5.24%) |
350.05 |
340.45 - 370.00 |
0.7779 times |
Fri 05 September 2025 |
349.90 (-0.31%) |
351.45 |
348.50 - 372.00 |
0.5991 times |
Fri 29 August 2025 |
351.00 (-4.66%) |
368.75 |
342.80 - 381.40 |
0.6751 times |
Fri 22 August 2025 |
368.15 (2.49%) |
361.45 |
356.50 - 375.90 |
0.5992 times |
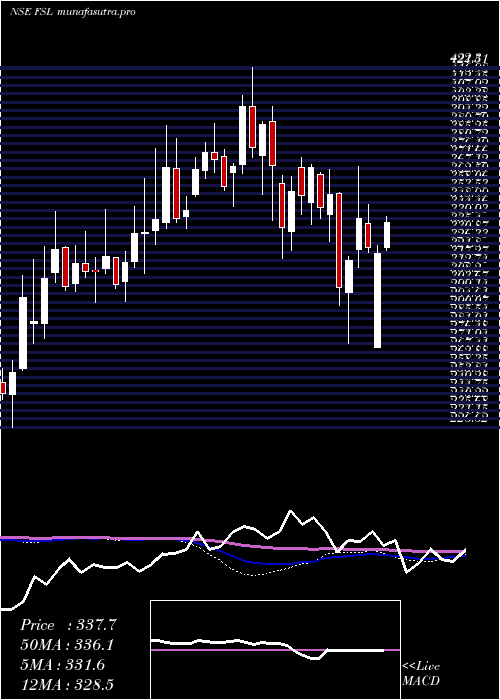
Monthly price and charts FirstsourceSolutions Strong monthly Stock price targets for FirstsourceSolutions FSL are 330.05 and 369.65 | Monthly Target 1 | 299.1 | | Monthly Target 2 | 321.4 | | Monthly Target 3 | 338.7 | | Monthly Target 4 | 361 | | Monthly Target 5 | 378.3 |
Monthly price and volumes Firstsource Solutions
| Date |
Closing |
Open |
Range |
Volume |
Tue 28 October 2025 |
343.70 (4.53%) |
329.00 |
316.40 - 356.00 |
0.6942 times |
Tue 30 September 2025 |
328.80 (-6.32%) |
351.45 |
321.30 - 379.70 |
0.4655 times |
Fri 29 August 2025 |
351.00 (2.72%) |
341.90 |
331.00 - 381.40 |
0.4706 times |
Thu 31 July 2025 |
341.70 (-8.79%) |
377.70 |
326.75 - 377.70 |
0.4965 times |
Mon 30 June 2025 |
374.65 (0.86%) |
371.40 |
368.70 - 403.80 |
0.5961 times |
Fri 30 May 2025 |
371.45 (9.03%) |
338.90 |
307.00 - 398.60 |
0.9801 times |
Wed 30 April 2025 |
340.70 (0.13%) |
337.10 |
270.00 - 360.85 |
0.7413 times |
Fri 28 March 2025 |
340.25 (-1.66%) |
342.50 |
272.25 - 368.60 |
1.6971 times |
Fri 28 February 2025 |
346.00 (3.24%) |
333.05 |
322.50 - 373.30 |
1.379 times |
Fri 31 January 2025 |
335.15 (-10.86%) |
374.50 |
318.40 - 422.30 |
2.4797 times |
Tue 31 December 2024 |
376.00 (2.54%) |
366.00 |
346.45 - 391.50 |
1.07 times |

DMA SMA EMA moving averages of Firstsource Solutions FSL
DMA (daily moving average) of Firstsource Solutions FSL
| DMA period | DMA value | | 5 day DMA | 333.12 | | 12 day DMA | 328.9 | | 20 day DMA | 327.94 | | 35 day DMA | 342.58 | | 50 day DMA | 348.31 | | 100 day DMA | 356.24 | | 150 day DMA | 353.64 | | 200 day DMA | 353.25 | EMA (exponential moving average) of Firstsource Solutions FSL
| EMA period | EMA current | EMA prev | EMA prev2 | | 5 day EMA | 336.81 | 333.36 | 323.72 | | 12 day EMA | 332.38 | 330.32 | 326.26 | | 20 day EMA | 334.14 | 333.13 | 331.08 | | 35 day EMA | 339.65 | 339.41 | 338.63 | | 50 day EMA | 348.49 | 348.69 | 348.53 |
SMA (simple moving average) of Firstsource Solutions FSL
| SMA period | SMA current | SMA prev | SMA prev2 | | 5 day SMA | 333.12 | 328.07 | 322.91 | | 12 day SMA | 328.9 | 327.63 | 325.41 | | 20 day SMA | 327.94 | 328.34 | 328.46 | | 35 day SMA | 342.58 | 342.76 | 343.01 | | 50 day SMA | 348.31 | 348.78 | 349.06 | | 100 day SMA | 356.24 | 356.61 | 356.89 | | 150 day SMA | 353.64 | 353.31 | 352.86 | | 200 day SMA | 353.25 | 353.48 | 353.73 |
|
|
