IcicipramcIcicifmcg FMCGIETF full analysis,charts,indicators,moving averages,SMA,DMA,EMA,ADX,MACD,RSIIcicipramc Icicifmcg FMCGIETF WideScreen charts, DMA,SMA,EMA technical analysis, forecast prediction, by indicators ADX,MACD,RSI,CCI NSE stock exchange
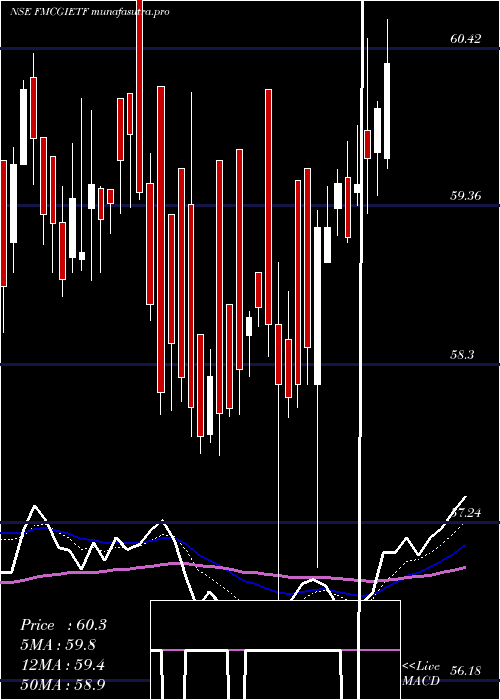
Daily price and charts and targets IcicipramcIcicifmcg Strong Daily Stock price targets for IcicipramcIcicifmcg FMCGIETF are 60.07 and 60.58 | Daily Target 1 | 59.65 | | Daily Target 2 | 59.98 | | Daily Target 3 | 60.163333333333 | | Daily Target 4 | 60.49 | | Daily Target 5 | 60.67 |
Daily price and volume Icicipramc Icicifmcg
| Date |
Closing |
Open |
Range |
Volume |
Wed 29 October 2025 |
60.30 (0.79%) |
59.95 |
59.84 - 60.35 |
0.6118 times |
Tue 28 October 2025 |
59.83 (-0.57%) |
60.17 |
59.62 - 60.47 |
0.4822 times |
Mon 27 October 2025 |
60.17 (0.18%) |
60.06 |
59.96 - 60.39 |
0.8425 times |
Fri 24 October 2025 |
60.06 (-0.73%) |
60.83 |
59.63 - 60.83 |
0.8467 times |
Thu 23 October 2025 |
60.50 (0.28%) |
60.69 |
60.35 - 61.19 |
1.7963 times |
Tue 21 October 2025 |
60.33 (0.05%) |
60.60 |
59.87 - 60.70 |
0.2587 times |
Mon 20 October 2025 |
60.30 (0.02%) |
60.59 |
60.23 - 60.72 |
0.7929 times |
Fri 17 October 2025 |
60.29 (1.31%) |
59.51 |
59.51 - 60.53 |
2.2074 times |
Thu 16 October 2025 |
59.51 (1.94%) |
58.67 |
58.36 - 59.60 |
1.5678 times |
Wed 15 October 2025 |
58.38 (0.78%) |
57.96 |
57.95 - 58.50 |
0.5937 times |
Tue 14 October 2025 |
57.93 (-0.48%) |
58.50 |
57.85 - 58.54 |
1.1132 times |
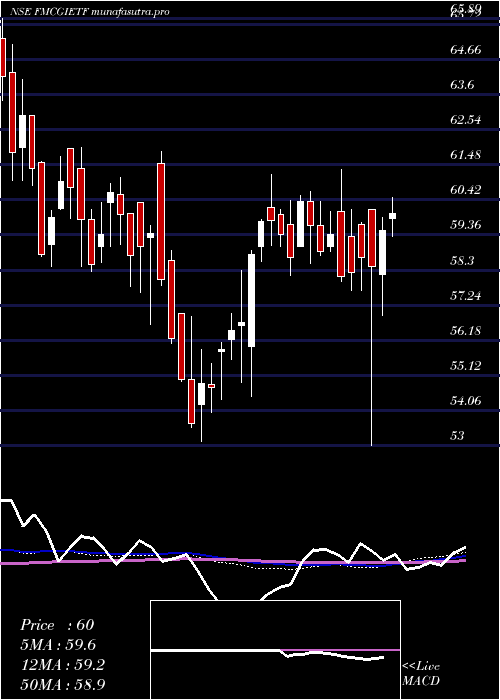
Weekly price and charts IcicipramcIcicifmcg Strong weekly Stock price targets for IcicipramcIcicifmcg FMCGIETF are 59.96 and 60.81 | Weekly Target 1 | 59.28 | | Weekly Target 2 | 59.79 | | Weekly Target 3 | 60.13 | | Weekly Target 4 | 60.64 | | Weekly Target 5 | 60.98 |
Weekly price and volumes for Icicipramc Icicifmcg
| Date |
Closing |
Open |
Range |
Volume |
Wed 29 October 2025 |
60.30 (0.4%) |
60.06 |
59.62 - 60.47 |
0.4683 times |
Fri 24 October 2025 |
60.06 (-0.38%) |
60.59 |
59.63 - 61.19 |
0.8934 times |
Fri 17 October 2025 |
60.29 (2.66%) |
58.73 |
57.85 - 60.53 |
1.6313 times |
Fri 10 October 2025 |
58.73 (-0.34%) |
59.11 |
58.09 - 59.12 |
0.7823 times |
Fri 03 October 2025 |
58.93 (0.74%) |
58.90 |
58.10 - 59.10 |
0.7137 times |
Fri 26 September 2025 |
58.50 (-2.69%) |
60.21 |
58.41 - 60.39 |
1.1718 times |
Fri 19 September 2025 |
60.12 (-0.4%) |
60.37 |
60.01 - 60.78 |
1.1311 times |
Fri 12 September 2025 |
60.36 (0.27%) |
60.23 |
59.05 - 61.73 |
0.8999 times |
Fri 05 September 2025 |
60.20 (0.35%) |
60.41 |
59.70 - 62.30 |
1.6813 times |
Fri 29 August 2025 |
59.99 (0.71%) |
59.98 |
59.12 - 60.46 |
0.6268 times |
Fri 22 August 2025 |
59.57 (2.09%) |
59.49 |
58.35 - 61.00 |
0.8477 times |
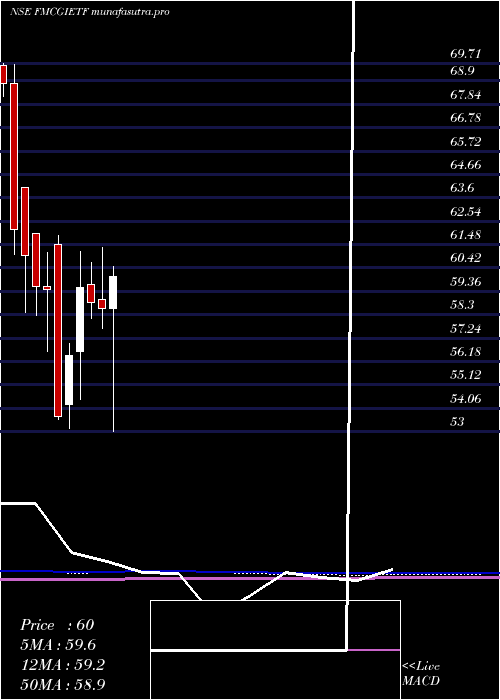
Monthly price and charts IcicipramcIcicifmcg Strong monthly Stock price targets for IcicipramcIcicifmcg FMCGIETF are 59.08 and 62.42 | Monthly Target 1 | 56.44 | | Monthly Target 2 | 58.37 | | Monthly Target 3 | 59.78 | | Monthly Target 4 | 61.71 | | Monthly Target 5 | 63.12 |
Monthly price and volumes Icicipramc Icicifmcg
| Date |
Closing |
Open |
Range |
Volume |
Wed 29 October 2025 |
60.30 (3.24%) |
58.76 |
57.85 - 61.19 |
0.9808 times |
Tue 30 September 2025 |
58.41 (-2.63%) |
60.41 |
58.10 - 62.30 |
1.2911 times |
Fri 29 August 2025 |
59.99 (0.91%) |
59.45 |
57.51 - 61.00 |
0.6645 times |
Thu 31 July 2025 |
59.45 (1.52%) |
58.56 |
53.00 - 61.74 |
1.2238 times |
Mon 30 June 2025 |
58.56 (-0.53%) |
59.01 |
57.69 - 61.33 |
1.1535 times |
Fri 30 May 2025 |
58.87 (-1.09%) |
59.66 |
58.12 - 60.66 |
0.9604 times |
Wed 30 April 2025 |
59.52 (5.4%) |
56.64 |
54.47 - 61.18 |
0.8556 times |
Fri 28 March 2025 |
56.47 (5.2%) |
54.24 |
53.12 - 56.98 |
0.9008 times |
Fri 28 February 2025 |
53.68 (-9.66%) |
61.50 |
53.53 - 61.87 |
1.0848 times |
Fri 31 January 2025 |
59.42 (-0.24%) |
59.59 |
56.65 - 61.10 |
0.8846 times |
Tue 31 December 2024 |
59.56 (-2.33%) |
61.97 |
58.25 - 61.99 |
1.1787 times |
DMA SMA EMA moving averages of Icicipramc Icicifmcg FMCGIETF
DMA (daily moving average) of Icicipramc Icicifmcg FMCGIETF
| DMA period | DMA value | | 5 day DMA | 60.17 | | 12 day DMA | 59.65 | | 20 day DMA | 59.24 | | 35 day DMA | 59.49 | | 50 day DMA | 59.65 | | 100 day DMA | 59.3 | | 150 day DMA | 59.13 | | 200 day DMA | 58.59 | EMA (exponential moving average) of Icicipramc Icicifmcg FMCGIETF
| EMA period | EMA current | EMA prev | EMA prev2 | | 5 day EMA | 60.11 | 60.01 | 60.1 | | 12 day EMA | 59.8 | 59.71 | 59.69 | | 20 day EMA | 59.6 | 59.53 | 59.5 | | 35 day EMA | 59.54 | 59.5 | 59.48 | | 50 day EMA | 59.61 | 59.58 | 59.57 |
SMA (simple moving average) of Icicipramc Icicifmcg FMCGIETF
| SMA period | SMA current | SMA prev | SMA prev2 | | 5 day SMA | 60.17 | 60.18 | 60.27 | | 12 day SMA | 59.65 | 59.52 | 59.41 | | 20 day SMA | 59.24 | 59.16 | 59.09 | | 35 day SMA | 59.49 | 59.48 | 59.49 | | 50 day SMA | 59.65 | 59.61 | 59.59 | | 100 day SMA | 59.3 | 59.29 | 59.29 | | 150 day SMA | 59.13 | 59.1 | 59.07 | | 200 day SMA | 58.59 | 58.58 | 58.58 |
|
|
