FinoPayments FINOPB full analysis,charts,indicators,moving averages,SMA,DMA,EMA,ADX,MACD,RSIFino Payments FINOPB WideScreen charts, DMA,SMA,EMA technical analysis, forecast prediction, by indicators ADX,MACD,RSI,CCI NSE stock exchange
Daily price and charts and targets FinoPayments Strong Daily Stock price targets for FinoPayments FINOPB are 297.58 and 312.58 | Daily Target 1 | 294.68 | | Daily Target 2 | 300.47 | | Daily Target 3 | 309.68333333333 | | Daily Target 4 | 315.47 | | Daily Target 5 | 324.68 |
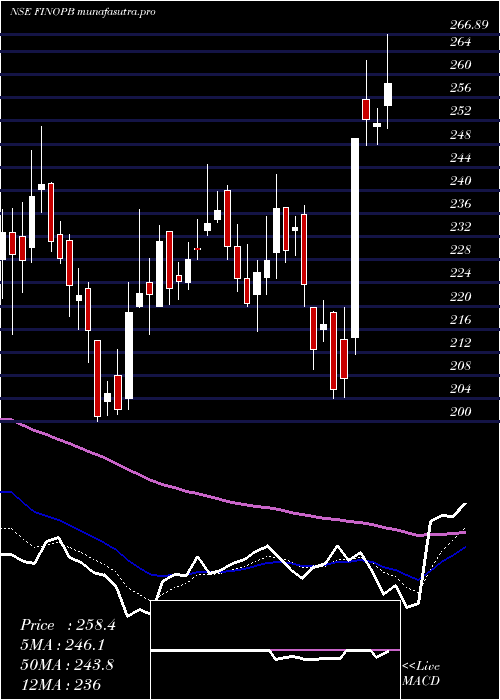
Daily price and volume Fino Payments
| Date |
Closing |
Open |
Range |
Volume |
Tue 28 October 2025 |
306.25 (-3.56%) |
317.00 |
303.90 - 318.90 |
0.675 times |
Mon 27 October 2025 |
317.55 (-0.45%) |
319.20 |
314.25 - 324.80 |
0.44 times |
Fri 24 October 2025 |
319.00 (-0.9%) |
325.00 |
317.05 - 326.50 |
0.2044 times |
Thu 23 October 2025 |
321.90 (-3.75%) |
332.15 |
317.80 - 334.00 |
0.6317 times |
Tue 21 October 2025 |
334.45 (1.16%) |
332.90 |
327.30 - 339.00 |
0.4323 times |
Mon 20 October 2025 |
330.60 (0.53%) |
328.85 |
323.10 - 333.65 |
0.4453 times |
Fri 17 October 2025 |
328.85 (-0.36%) |
329.80 |
324.30 - 333.75 |
0.5431 times |
Thu 16 October 2025 |
330.05 (-1.77%) |
336.00 |
319.90 - 336.00 |
1.2399 times |
Wed 15 October 2025 |
336.00 (7.18%) |
315.50 |
315.00 - 338.30 |
3.5332 times |
Tue 14 October 2025 |
313.50 (0.21%) |
315.00 |
309.05 - 319.25 |
1.8553 times |
Mon 13 October 2025 |
312.85 (4.32%) |
296.35 |
296.00 - 314.80 |
1.7062 times |
Weekly price and charts FinoPayments Strong weekly Stock price targets for FinoPayments FINOPB are 294.63 and 315.53 | Weekly Target 1 | 290.75 | | Weekly Target 2 | 298.5 | | Weekly Target 3 | 311.65 | | Weekly Target 4 | 319.4 | | Weekly Target 5 | 332.55 |
Weekly price and volumes for Fino Payments
| Date |
Closing |
Open |
Range |
Volume |
Tue 28 October 2025 |
306.25 (-4%) |
319.20 |
303.90 - 324.80 |
0.295 times |
Fri 24 October 2025 |
319.00 (-3%) |
328.85 |
317.05 - 339.00 |
0.4534 times |
Fri 17 October 2025 |
328.85 (9.65%) |
296.35 |
296.00 - 338.30 |
2.349 times |
Fri 10 October 2025 |
299.90 (4.13%) |
288.90 |
288.90 - 316.30 |
2.7563 times |
Fri 03 October 2025 |
288.00 (10.15%) |
260.15 |
259.55 - 293.20 |
0.8053 times |
Fri 26 September 2025 |
261.45 (-4.86%) |
272.00 |
257.85 - 282.00 |
0.3026 times |
Fri 19 September 2025 |
274.80 (-1.75%) |
278.00 |
273.00 - 287.20 |
0.5874 times |
Fri 12 September 2025 |
279.70 (3.52%) |
270.20 |
264.30 - 286.60 |
0.6355 times |
Fri 05 September 2025 |
270.20 (-3.83%) |
283.00 |
265.15 - 289.00 |
0.7166 times |
Fri 29 August 2025 |
280.95 (6.02%) |
267.90 |
259.10 - 286.00 |
1.0989 times |
Fri 22 August 2025 |
265.00 (6.06%) |
252.55 |
248.00 - 277.90 |
1.1286 times |

Monthly price and charts FinoPayments Strong monthly Stock price targets for FinoPayments FINOPB are 287.53 and 357.73 | Monthly Target 1 | 234.48 | | Monthly Target 2 | 270.37 | | Monthly Target 3 | 304.68333333333 | | Monthly Target 4 | 340.57 | | Monthly Target 5 | 374.88 |
Monthly price and volumes Fino Payments
| Date |
Closing |
Open |
Range |
Volume |
Tue 28 October 2025 |
306.25 (13.89%) |
268.80 |
268.80 - 339.00 |
0.9668 times |
Tue 30 September 2025 |
268.90 (-4.29%) |
283.00 |
257.85 - 289.00 |
0.3573 times |
Fri 29 August 2025 |
280.95 (4.83%) |
268.00 |
239.20 - 286.00 |
0.5342 times |
Thu 31 July 2025 |
268.00 (-5.45%) |
284.80 |
252.55 - 314.70 |
1.0171 times |
Mon 30 June 2025 |
283.46 (18.61%) |
239.10 |
236.00 - 324.00 |
3.7049 times |
Fri 30 May 2025 |
238.99 (-2.93%) |
247.00 |
225.14 - 259.01 |
0.4555 times |
Wed 30 April 2025 |
246.20 (8.03%) |
229.30 |
204.02 - 280.75 |
1.7675 times |
Fri 28 March 2025 |
227.89 (2.72%) |
223.00 |
200.00 - 244.40 |
0.6824 times |
Fri 28 February 2025 |
221.85 (-23.66%) |
290.00 |
215.00 - 306.00 |
0.3201 times |
Fri 31 January 2025 |
290.60 (-8.44%) |
315.00 |
264.75 - 345.00 |
0.1943 times |
Tue 31 December 2024 |
317.40 (-14.29%) |
370.00 |
311.20 - 370.00 |
0.4168 times |

DMA SMA EMA moving averages of Fino Payments FINOPB
DMA (daily moving average) of Fino Payments FINOPB
| DMA period | DMA value | | 5 day DMA | 319.83 | | 12 day DMA | 320.91 | | 20 day DMA | 308.33 | | 35 day DMA | 292.94 | | 50 day DMA | 285.64 | | 100 day DMA | 280.15 | | 150 day DMA | 266.82 | | 200 day DMA | 265.64 | EMA (exponential moving average) of Fino Payments FINOPB
| EMA period | EMA current | EMA prev | EMA prev2 | | 5 day EMA | 316.64 | 321.84 | 323.99 | | 12 day EMA | 315.88 | 317.63 | 317.65 | | 20 day EMA | 309.21 | 309.52 | 308.67 | | 35 day EMA | 298.48 | 298.02 | 296.87 | | 50 day EMA | 286.06 | 285.24 | 283.92 |
SMA (simple moving average) of Fino Payments FINOPB
| SMA period | SMA current | SMA prev | SMA prev2 | | 5 day SMA | 319.83 | 324.7 | 326.96 | | 12 day SMA | 320.91 | 320.43 | 319.11 | | 20 day SMA | 308.33 | 306.09 | 303.37 | | 35 day SMA | 292.94 | 291.91 | 290.61 | | 50 day SMA | 285.64 | 284.62 | 283.2 | | 100 day SMA | 280.15 | 279.51 | 278.8 | | 150 day SMA | 266.82 | 266.31 | 265.71 | | 200 day SMA | 265.64 | 265.71 | 265.82 |
|
|
