FinkurveFinancial FINKURVE full analysis,charts,indicators,moving averages,SMA,DMA,EMA,ADX,MACD,RSIFinkurve Financial FINKURVE WideScreen charts, DMA,SMA,EMA technical analysis, forecast prediction, by indicators ADX,MACD,RSI,CCI NSE stock exchange
Daily price and charts and targets FinkurveFinancial Strong Daily Stock price targets for FinkurveFinancial FINKURVE are 112.72 and 117.91 | Daily Target 1 | 111.62 | | Daily Target 2 | 113.81 | | Daily Target 3 | 116.80666666667 | | Daily Target 4 | 119 | | Daily Target 5 | 122 |
Daily price and volume Finkurve Financial
| Date |
Closing |
Open |
Range |
Volume |
Tue 28 October 2025 |
116.01 (-0.34%) |
119.80 |
114.61 - 119.80 |
0.2191 times |
Mon 27 October 2025 |
116.41 (1.15%) |
117.65 |
114.40 - 118.00 |
0.812 times |
Fri 24 October 2025 |
115.09 (-2.44%) |
120.89 |
114.10 - 120.89 |
0.747 times |
Thu 23 October 2025 |
117.97 (-3.08%) |
121.70 |
117.50 - 125.00 |
1.1434 times |
Tue 21 October 2025 |
121.72 (2.84%) |
121.00 |
119.20 - 123.99 |
0.1354 times |
Mon 20 October 2025 |
118.36 (-0.5%) |
121.46 |
117.13 - 123.50 |
0.6942 times |
Fri 17 October 2025 |
118.96 (-0.53%) |
120.48 |
117.10 - 123.47 |
1.9666 times |
Thu 16 October 2025 |
119.59 (1.49%) |
121.49 |
118.00 - 123.84 |
2.4833 times |
Wed 15 October 2025 |
117.84 (0.77%) |
118.91 |
116.10 - 124.90 |
1.0193 times |
Tue 14 October 2025 |
116.94 (0.46%) |
116.40 |
115.65 - 118.80 |
0.7797 times |
Mon 13 October 2025 |
116.40 (-5.92%) |
122.99 |
115.10 - 127.69 |
2.3881 times |
Weekly price and charts FinkurveFinancial Strong weekly Stock price targets for FinkurveFinancial FINKURVE are 112.51 and 117.91 | Weekly Target 1 | 111.34 | | Weekly Target 2 | 113.67 | | Weekly Target 3 | 116.73666666667 | | Weekly Target 4 | 119.07 | | Weekly Target 5 | 122.14 |
Weekly price and volumes for Finkurve Financial
| Date |
Closing |
Open |
Range |
Volume |
Tue 28 October 2025 |
116.01 (0.8%) |
117.65 |
114.40 - 119.80 |
0.1114 times |
Fri 24 October 2025 |
115.09 (-3.25%) |
121.46 |
114.10 - 125.00 |
0.2938 times |
Fri 17 October 2025 |
118.96 (-3.86%) |
122.99 |
115.10 - 127.69 |
0.9329 times |
Fri 10 October 2025 |
123.73 (0%) |
133.80 |
110.71 - 134.90 |
2.662 times |
Wed 29 October 2025 |
(0%) |
|
- |
0 times |

Monthly price and charts FinkurveFinancial Strong monthly Stock price targets for FinkurveFinancial FINKURVE are 110.51 and 140.41 | Monthly Target 1 | 88.74 | | Monthly Target 2 | 102.37 | | Monthly Target 3 | 118.63666666667 | | Monthly Target 4 | 132.27 | | Monthly Target 5 | 148.54 |
Monthly price and volumes Finkurve Financial
| Date |
Closing |
Open |
Range |
Volume |
Tue 28 October 2025 |
116.01 (0%) |
105.00 |
105.00 - 134.90 |
1 times |
Wed 29 October 2025 |
(0%) |
|
- |
0 times |

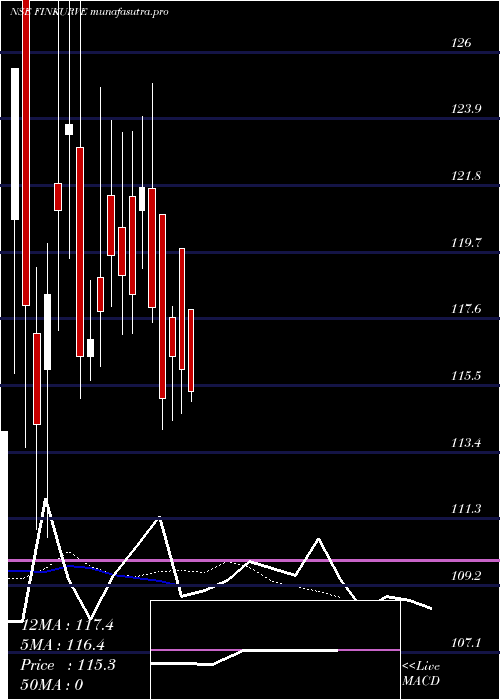
DMA SMA EMA moving averages of Finkurve Financial FINKURVE
DMA (daily moving average) of Finkurve Financial FINKURVE
| DMA period | DMA value | | 5 day DMA | 117.44 | | 12 day DMA | 118.25 | | 20 day DMA | | | 35 day DMA | | | 50 day DMA | | | 100 day DMA | | | 150 day DMA | | | 200 day DMA | | EMA (exponential moving average) of Finkurve Financial FINKURVE
| EMA period | EMA current | EMA prev | EMA prev2 | | 5 day EMA | 116.88 | 117.31 | 117.76 | | 12 day EMA | 117.74 | 118.06 | 118.36 | | 20 day EMA | 0 | 0 | 0 | | 35 day EMA | 0 | 0 | 0 | | 50 day EMA | 0 | 0 | 0 |
SMA (simple moving average) of Finkurve Financial FINKURVE
| SMA period | SMA current | SMA prev | SMA prev2 | | 5 day SMA | 117.44 | 117.91 | 118.42 | | 12 day SMA | 118.25 | 118.67 | 118.83 | | 20 day SMA | | 35 day SMA | | 50 day SMA | | 100 day SMA | | 150 day SMA | | 200 day SMA |
|
|
