FelixIndustries FELIX_ST full analysis,charts,indicators,moving averages,SMA,DMA,EMA,ADX,MACD,RSIFelix Industries FELIX_ST WideScreen charts, DMA,SMA,EMA technical analysis, forecast prediction, by indicators ADX,MACD,RSI,CCI NSE stock exchange
Daily price and charts and targets FelixIndustries Strong Daily Stock price targets for FelixIndustries FELIX_ST are 157.45 and 164.25 | Daily Target 1 | 156.03 | | Daily Target 2 | 158.87 | | Daily Target 3 | 162.83333333333 | | Daily Target 4 | 165.67 | | Daily Target 5 | 169.63 |
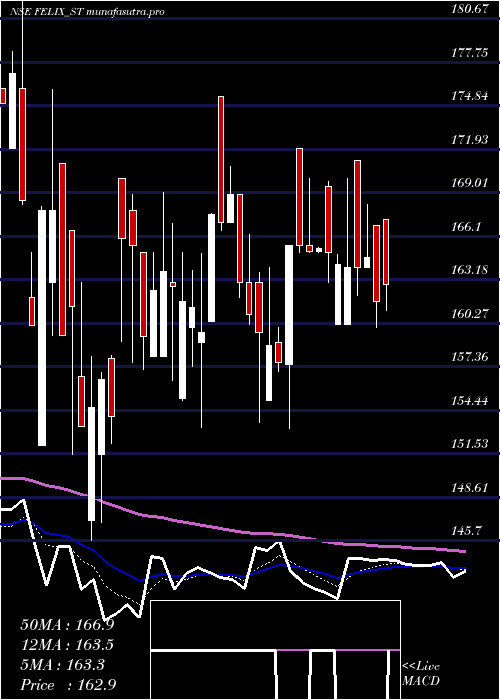
Daily price and volume Felix Industries
| Date |
Closing |
Open |
Range |
Volume |
| Wed 04 June 2025 |
161.70 (-1.82%) |
166.80 |
160.00 - 166.80 |
0.6814 times |
| Tue 03 June 2025 |
164.70 (0.43%) |
164.00 |
164.00 - 168.20 |
0.5157 times |
| Mon 02 June 2025 |
164.00 (0%) |
171.20 |
162.10 - 171.20 |
0.6262 times |
| Fri 30 May 2025 |
164.00 (-0.12%) |
160.20 |
160.20 - 169.95 |
1.3812 times |
| Thu 29 May 2025 |
164.20 (-0.48%) |
160.20 |
160.20 - 164.90 |
0.4236 times |
| Wed 28 May 2025 |
165.00 (-0.15%) |
169.45 |
163.00 - 169.75 |
0.7735 times |
| Tue 27 May 2025 |
165.25 (0.09%) |
165.10 |
165.00 - 165.35 |
0.7182 times |
| Mon 26 May 2025 |
165.10 (-0.24%) |
165.50 |
165.00 - 169.95 |
0.5893 times |
| Fri 23 May 2025 |
165.50 (0.03%) |
171.95 |
165.00 - 171.95 |
1.1971 times |
| Thu 22 May 2025 |
165.45 (4.95%) |
157.50 |
153.20 - 165.50 |
3.0939 times |
| Wed 21 May 2025 |
157.65 (-0.72%) |
159.00 |
157.00 - 160.00 |
0.9208 times |
Weekly price and charts FelixIndustries Strong weekly Stock price targets for FelixIndustries FELIX_ST are 155.25 and 166.45 | Weekly Target 1 | 153.1 | | Weekly Target 2 | 157.4 | | Weekly Target 3 | 164.3 | | Weekly Target 4 | 168.6 | | Weekly Target 5 | 175.5 |
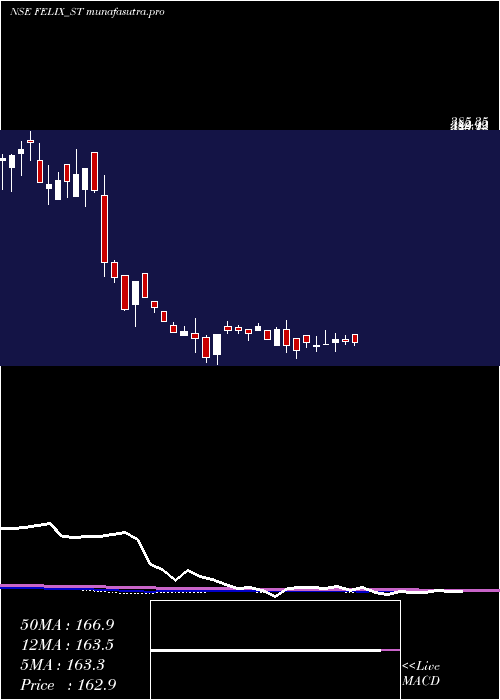
Weekly price and volumes for Felix Industries
| Date |
Closing |
Open |
Range |
Volume |
| Wed 04 June 2025 |
161.70 (-1.4%) |
171.20 |
160.00 - 171.20 |
0.4242 times |
| Fri 30 May 2025 |
164.00 (-0.91%) |
165.50 |
160.20 - 169.95 |
0.904 times |
| Fri 23 May 2025 |
165.50 (2.89%) |
163.00 |
153.20 - 171.95 |
1.7309 times |
| Fri 16 May 2025 |
160.85 (0.75%) |
160.40 |
160.15 - 175.45 |
0.6598 times |
| Fri 09 May 2025 |
159.65 (-1.72%) |
158.00 |
153.25 - 169.00 |
0.8955 times |
| Fri 02 May 2025 |
162.45 (5.49%) |
170.00 |
157.20 - 170.00 |
1.7395 times |
| Fri 21 February 2025 |
154.00 (-3.42%) |
166.50 |
145.70 - 166.50 |
1.1525 times |
| Fri 14 February 2025 |
159.45 (-9.92%) |
176.00 |
152.10 - 185.85 |
1.3325 times |
| Fri 07 February 2025 |
177.00 (6.82%) |
159.85 |
159.85 - 178.50 |
0.8055 times |
| Fri 31 January 2025 |
165.70 (-7.64%) |
175.85 |
165.70 - 175.85 |
0.3556 times |
| Fri 24 January 2025 |
179.40 (4.39%) |
175.25 |
175.00 - 183.05 |
1.2125 times |
Monthly price and charts FelixIndustries Strong monthly Stock price targets for FelixIndustries FELIX_ST are 155.25 and 166.45 | Monthly Target 1 | 153.1 | | Monthly Target 2 | 157.4 | | Monthly Target 3 | 164.3 | | Monthly Target 4 | 168.6 | | Monthly Target 5 | 175.5 |
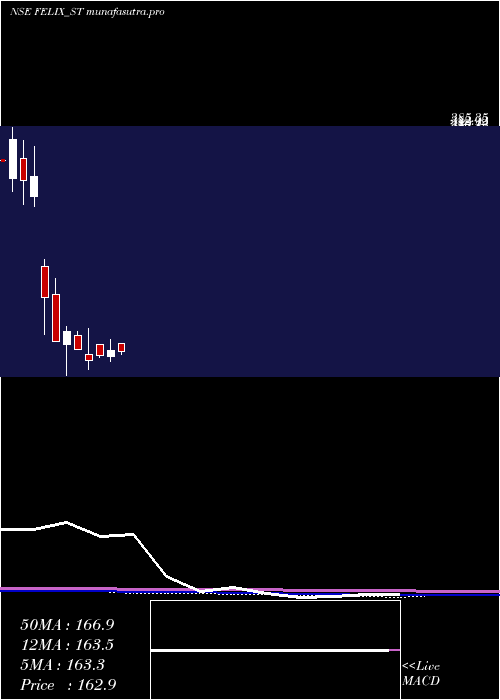
Monthly price and volumes Felix Industries
| Date |
Closing |
Open |
Range |
Volume |
| Wed 04 June 2025 |
161.70 (-1.4%) |
171.20 |
160.00 - 171.20 |
0.0894 times |
| Fri 30 May 2025 |
164.00 (2.92%) |
158.00 |
153.20 - 175.45 |
0.9363 times |
| Wed 30 April 2025 |
159.35 (3.47%) |
170.00 |
157.20 - 170.00 |
0.3133 times |
| Fri 21 February 2025 |
154.00 (-7.06%) |
159.85 |
145.70 - 185.85 |
0.6934 times |
| Fri 31 January 2025 |
165.70 (-9.43%) |
179.30 |
165.20 - 183.05 |
1.0771 times |
| Tue 31 December 2024 |
182.95 (5.6%) |
170.00 |
139.75 - 187.75 |
4.1612 times |
| Fri 29 November 2024 |
173.25 (-20.09%) |
220.00 |
173.25 - 236.00 |
0.7602 times |
| Thu 31 October 2024 |
216.80 (-35.67%) |
248.00 |
180.00 - 255.00 |
1.6044 times |
| Mon 22 April 2024 |
337.00 (1.2%) |
317.00 |
307.00 - 366.50 |
0.1733 times |
| Thu 28 March 2024 |
333.00 (-10.96%) |
355.30 |
308.85 - 373.05 |
0.1914 times |
| Thu 29 February 2024 |
374.00 (6.11%) |
334.85 |
322.20 - 385.35 |
0.4316 times |
DMA SMA EMA moving averages of Felix Industries FELIX_ST
DMA (daily moving average) of Felix Industries FELIX_ST
| DMA period | DMA value | | 5 day DMA | 163.72 | | 12 day DMA | 163.45 | | 20 day DMA | 163.46 | | 35 day DMA | 162.45 | | 50 day DMA | 165.43 | | 100 day DMA | 170.6 | | 150 day DMA | 209.31 | | 200 day DMA | | EMA (exponential moving average) of Felix Industries FELIX_ST
| EMA period | EMA current | EMA prev | EMA prev2 | | 5 day EMA | 163.47 | 164.35 | 164.17 | | 12 day EMA | 163.6 | 163.94 | 163.8 | | 20 day EMA | 163.62 | 163.82 | 163.73 | | 35 day EMA | 164.8 | 164.98 | 165 | | 50 day EMA | 165.78 | 165.95 | 166 |
SMA (simple moving average) of Felix Industries FELIX_ST
| SMA period | SMA current | SMA prev | SMA prev2 | | 5 day SMA | 163.72 | 164.38 | 164.49 | | 12 day SMA | 163.45 | 163.28 | 162.95 | | 20 day SMA | 163.46 | 163.47 | 163.37 | | 35 day SMA | 162.45 | 162.4 | 162.51 | | 50 day SMA | 165.43 | 165.77 | 165.98 | | 100 day SMA | 170.6 | 171.13 | 171.67 | | 150 day SMA | 209.31 | 210.6 | 212 | | 200 day SMA |
|
|
