FelixIndustries FELIX_SM full analysis,charts,indicators,moving averages,SMA,DMA,EMA,ADX,MACD,RSIFelix Industries FELIX_SM WideScreen charts, DMA,SMA,EMA technical analysis, forecast prediction, by indicators ADX,MACD,RSI,CCI NSE stock exchange
Daily price and charts and targets FelixIndustries Strong Daily Stock price targets for FelixIndustries FELIX_SM are 178.28 and 181.23 | Daily Target 1 | 175.9 | | Daily Target 2 | 177.7 | | Daily Target 3 | 178.85 | | Daily Target 4 | 180.65 | | Daily Target 5 | 181.8 |
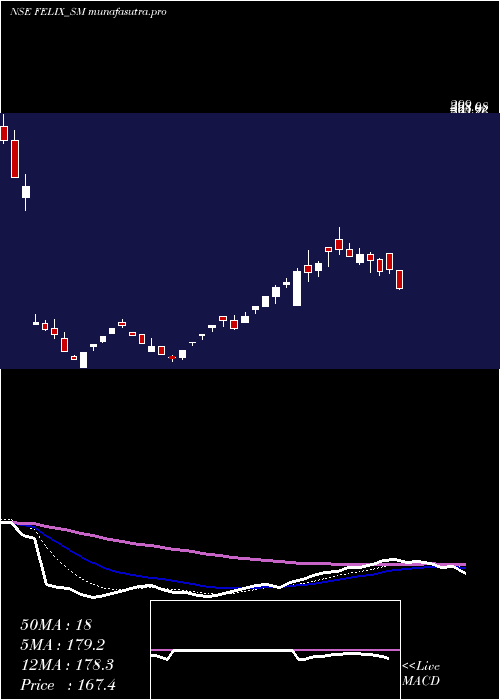
Daily price and volume Felix Industries
| Date |
Closing |
Open |
Range |
Volume |
Tue 28 October 2025 |
179.50 (1.33%) |
178.00 |
177.05 - 180.00 |
0.3443 times |
Mon 27 October 2025 |
177.15 (-0.28%) |
177.50 |
175.30 - 180.35 |
0.4161 times |
Fri 24 October 2025 |
177.65 (1.02%) |
173.00 |
172.75 - 192.90 |
3.0703 times |
Thu 23 October 2025 |
175.85 (-5.05%) |
185.20 |
170.05 - 185.20 |
2.0373 times |
Tue 21 October 2025 |
185.20 (2.58%) |
180.50 |
180.50 - 186.00 |
0.4017 times |
Mon 20 October 2025 |
180.55 (-3.32%) |
176.20 |
176.20 - 183.90 |
1.1047 times |
Fri 17 October 2025 |
186.75 (-0.66%) |
188.00 |
185.10 - 190.70 |
0.9182 times |
Thu 16 October 2025 |
188.00 (-0.32%) |
188.00 |
186.00 - 190.00 |
0.373 times |
Wed 15 October 2025 |
188.60 (0.08%) |
193.80 |
186.25 - 193.80 |
0.3156 times |
Tue 14 October 2025 |
188.45 (-2.86%) |
191.10 |
183.00 - 195.50 |
1.0187 times |
Mon 13 October 2025 |
194.00 (-1.3%) |
196.55 |
190.75 - 196.55 |
0.7747 times |
Weekly price and charts FelixIndustries Strong weekly Stock price targets for FelixIndustries FELIX_SM are 177.4 and 182.45 | Weekly Target 1 | 173.33 | | Weekly Target 2 | 176.42 | | Weekly Target 3 | 178.38333333333 | | Weekly Target 4 | 181.47 | | Weekly Target 5 | 183.43 |
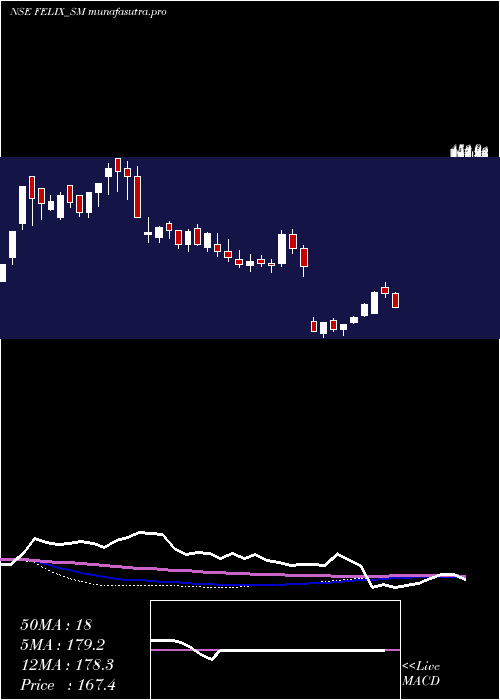
Weekly price and volumes for Felix Industries
| Date |
Closing |
Open |
Range |
Volume |
Tue 28 October 2025 |
179.50 (1.04%) |
177.50 |
175.30 - 180.35 |
0.1566 times |
Fri 24 October 2025 |
177.65 (-4.87%) |
176.20 |
170.05 - 192.90 |
1.3619 times |
Fri 17 October 2025 |
186.75 (-4.99%) |
196.55 |
183.00 - 196.55 |
0.7001 times |
Fri 10 October 2025 |
196.55 (-0.48%) |
200.00 |
175.05 - 200.00 |
0.5081 times |
Fri 03 October 2025 |
197.50 (5.17%) |
180.90 |
180.90 - 206.55 |
0.6647 times |
Fri 26 September 2025 |
187.80 (-9.67%) |
214.00 |
185.10 - 215.00 |
0.7917 times |
Fri 19 September 2025 |
207.90 (20.84%) |
181.00 |
179.00 - 220.00 |
3.6662 times |
Fri 12 September 2025 |
172.05 (-0.03%) |
172.30 |
170.00 - 177.00 |
0.4963 times |
Fri 05 September 2025 |
172.10 (-0.72%) |
174.00 |
172.00 - 181.00 |
0.9838 times |
Fri 29 August 2025 |
173.35 (-2.69%) |
180.00 |
170.10 - 180.00 |
0.6706 times |
Fri 22 August 2025 |
178.15 (1.77%) |
184.90 |
174.15 - 186.00 |
0.5229 times |
Monthly price and charts FelixIndustries Strong monthly Stock price targets for FelixIndustries FELIX_SM are 157.83 and 191.73 | Monthly Target 1 | 150.6 | | Monthly Target 2 | 165.05 | | Monthly Target 3 | 184.5 | | Monthly Target 4 | 198.95 | | Monthly Target 5 | 218.4 |
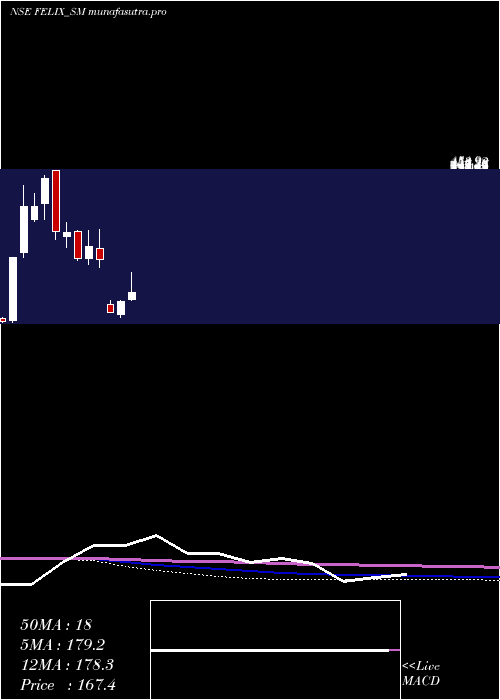
Monthly price and volumes Felix Industries
| Date |
Closing |
Open |
Range |
Volume |
Tue 28 October 2025 |
179.50 (-7.07%) |
194.00 |
170.05 - 203.95 |
0.3184 times |
Tue 30 September 2025 |
193.15 (11.42%) |
174.00 |
170.00 - 220.00 |
0.6722 times |
Fri 29 August 2025 |
173.35 (-6.45%) |
188.00 |
170.10 - 197.00 |
0.3174 times |
Thu 31 July 2025 |
185.30 (10.69%) |
211.95 |
180.60 - 212.30 |
0.2199 times |
Fri 25 April 2025 |
167.40 (14.15%) |
151.90 |
148.50 - 214.00 |
0.9755 times |
Fri 28 March 2025 |
146.65 (22.62%) |
116.10 |
108.00 - 149.10 |
0.9699 times |
Fri 28 February 2025 |
119.60 (-51.16%) |
140.00 |
119.60 - 148.00 |
0.1132 times |
Tue 08 October 2024 |
244.90 (-11.49%) |
271.10 |
226.75 - 316.80 |
1.3758 times |
Mon 30 September 2024 |
276.70 (11.01%) |
247.00 |
234.00 - 315.00 |
1.7883 times |
Fri 30 August 2024 |
249.25 (-19.62%) |
312.00 |
244.00 - 314.75 |
3.2494 times |
Wed 31 July 2024 |
310.10 (-0.18%) |
301.00 |
274.00 - 333.30 |
0.7541 times |
DMA SMA EMA moving averages of Felix Industries FELIX_SM
DMA (daily moving average) of Felix Industries FELIX_SM
| DMA period | DMA value | | 5 day DMA | 179.07 | | 12 day DMA | 184.85 | | 20 day DMA | 188.64 | | 35 day DMA | 189.01 | | 50 day DMA | 185.14 | | 100 day DMA | 172.43 | | 150 day DMA | 206.34 | | 200 day DMA | 243.78 | EMA (exponential moving average) of Felix Industries FELIX_SM
| EMA period | EMA current | EMA prev | EMA prev2 | | 5 day EMA | 179.6 | 179.65 | 180.9 | | 12 day EMA | 183.43 | 184.15 | 185.42 | | 20 day EMA | 185.68 | 186.33 | 187.3 | | 35 day EMA | 185.24 | 185.58 | 186.08 | | 50 day EMA | 184.12 | 184.31 | 184.6 |
SMA (simple moving average) of Felix Industries FELIX_SM
| SMA period | SMA current | SMA prev | SMA prev2 | | 5 day SMA | 179.07 | 179.28 | 181.2 | | 12 day SMA | 184.85 | 186.25 | 187.17 | | 20 day SMA | 188.64 | 189.06 | 189.99 | | 35 day SMA | 189.01 | 188.8 | 188.76 | | 50 day SMA | 185.14 | 185.06 | 185.09 | | 100 day SMA | 172.43 | 173.08 | 173.83 | | 150 day SMA | 206.34 | 207.24 | 208.06 | | 200 day SMA | 243.78 | 244.66 | 245.61 |
|
|
